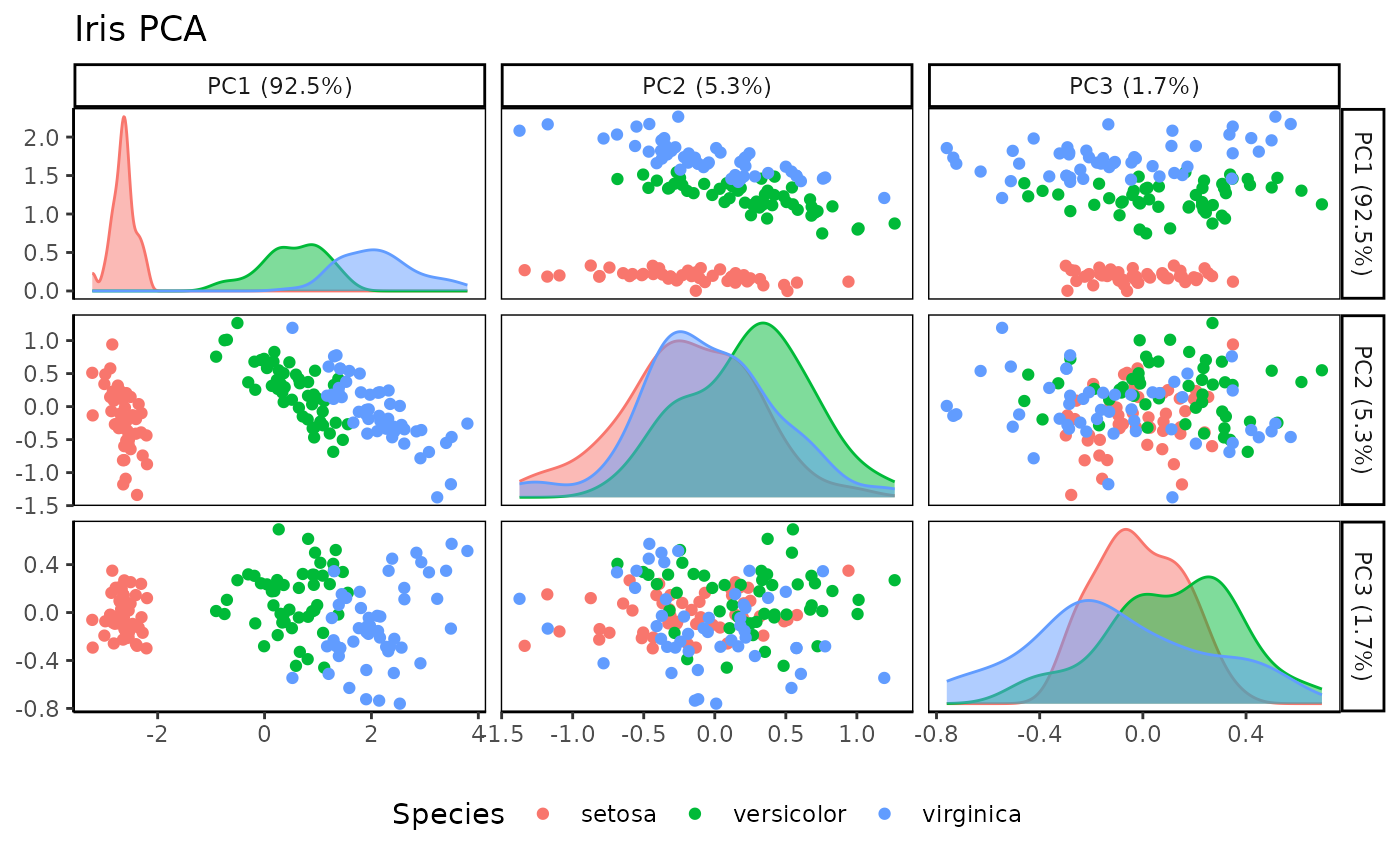
Only does "scores" PCA plots.
Usage
plot_PCA_matrix(
  df_pca,
  PCs = c(1:3),
  anno = NULL,
  annoname = "Sample",
  annotype = "Type",
  colors = NULL,
  title = NULL,
  savename = NULL,
  width = 8,
  height = 8
)
Arguments
- df_pca
string/
prcompobj; (path to) PCA output with sample names in first column- PCs
num vector; list of numeric PCs to plot (ex.
c(1:3)for first 3 PCs)- anno
string/df; Annotation info for DF
- annoname
string; Colname in
annomatching point name- annotype
string; Colname in
annowith info to color by- colors
char vector; For discrete
annotype, length should be number of uniqueannotypes.- title
string; Plot title
- savename
string; File path to save plot under
- width
numeric; Saved plot width
- height
numeric; Saved plot height