Setup
library(Rubrary)
library(dplyr)
#>
#> Attaching package: 'dplyr'
#> The following objects are masked from 'package:stats':
#>
#>     filter, lag
#> The following objects are masked from 'package:base':
#>
#>     intersect, setdiff, setequal, union
library(tibble)
This is a continuation of the “Differential
Gene Expression” vignette and loads in the airway
DESeq2 results to further investigate gene sets.
data("airway_deseq_res")
rmarkdown::paged_table(airway_deseq_res)
fgsea Gene Set Enrichment Analysis
fgsea [1] is an
implementation of an algorithm for fast gene set enrichment analysis
(GSEA), based on the original GSEA algorithm [2].
Get pathways from msigdbr
Gene set enrichment analysis relies on inputting gene sets / pathways
related to biological function. The Molecular Signatures Database
(MSigDB) [3] is a database of annotated
pathways to facilitate GSEA and is accessible through the R package
msigdbr [4].
C2CP: curated gene sets, canonical pathways
-
C5GO: ontology gene sets, Gene Ontology gene sets
BP: GO Biological Process ontology
CC: GO Cellular Component ontology
MF: GO Molecular Function ontology
H: hallmark gene sets [5]
This same list of gene sets from MSigDB is provided in Rubrary as
data object GSEA_pathways.
if (!requireNamespace("msigdbr", quietly = TRUE)){
  BiocManager::install("msigdbr")
}
#> 'getOption("repos")' replaces Bioconductor standard repositories, see
#> 'help("repositories", package = "BiocManager")' for details.
#> Replacement repositories:
#>     CRAN: https://cloud.r-project.org
#> Bioconductor version 3.17 (BiocManager 1.30.21.1), R 4.3.1 (2023-06-16)
#> Installing package(s) 'msigdbr'
#> also installing the dependency 'babelgene'
#> Installation paths not writeable, unable to update packages
#>   path: /opt/R/4.3.1/lib/R/library
#>   packages:
#>     KernSmooth, Matrix, mgcv, spatial

rmarkdown::paged_table(msigdbr::msigdbr_collections())
pthwys <- rbind(
  msigdbr::msigdbr(category = "C2", subcategory = "CP"),
  msigdbr::msigdbr(category = "C5", subcategory = "GO:BP"),
  msigdbr::msigdbr(category = "C5", subcategory = "GO:CC"),
  msigdbr::msigdbr(category = "C5", subcategory = "GO:MF"),
  msigdbr::msigdbr(category = "H")
) %>%
  split(x = .$gene_symbol, f = .$gs_name) # Named list of pathways
Run fgsea
See the GSEA User Guide: Interpreting GSEA Results for detailed explanation in interpreting results.
# `fgsea` requires a named numeric vector as input to the `stats` argument
deseq_stats <- setNames(
    airway_deseq_res[,"sign_log_p"],
    airway_deseq_res[,"hgnc_symbol"]
)

gsea_results <- fgsea::fgsea(
  pathways = pthwys,
  stats = deseq_stats,
  eps = 0.0,
  minSize = 15,
  maxSize  = 500) %>%
  arrange(desc(NES)) %>%
  mutate(sign_log10_p = sign(NES) * -log10(pval)) # Create sign_log10_p column
#> Warning in preparePathwaysAndStats(pathways, stats, minSize, maxSize, gseaParam, : There are ties in the preranked stats (6.92% of the list).
#> The order of those tied genes will be arbitrary, which may produce unexpected results.

rmarkdown::paged_table(gsea_results)
Visualize GSEA results as a table
Using fgsea’s plotGseaTable function.
# Get top significant pathways by positive/negative enrichment score (ES)
pos_pws <- gsea_results[ES > 0][head(order(pval), n = 5), pathway]
neg_pws <- gsea_results[ES < 0][head(order(pval), n = 5), pathway]
top_pws <- c(pos_pws, rev(neg_pws))

fgsea::plotGseaTable(
  pathways = pthwys[top_pws],
  stats = deseq_stats,
  fgseaRes = gsea_results,
  gseaParam = 0.5
)
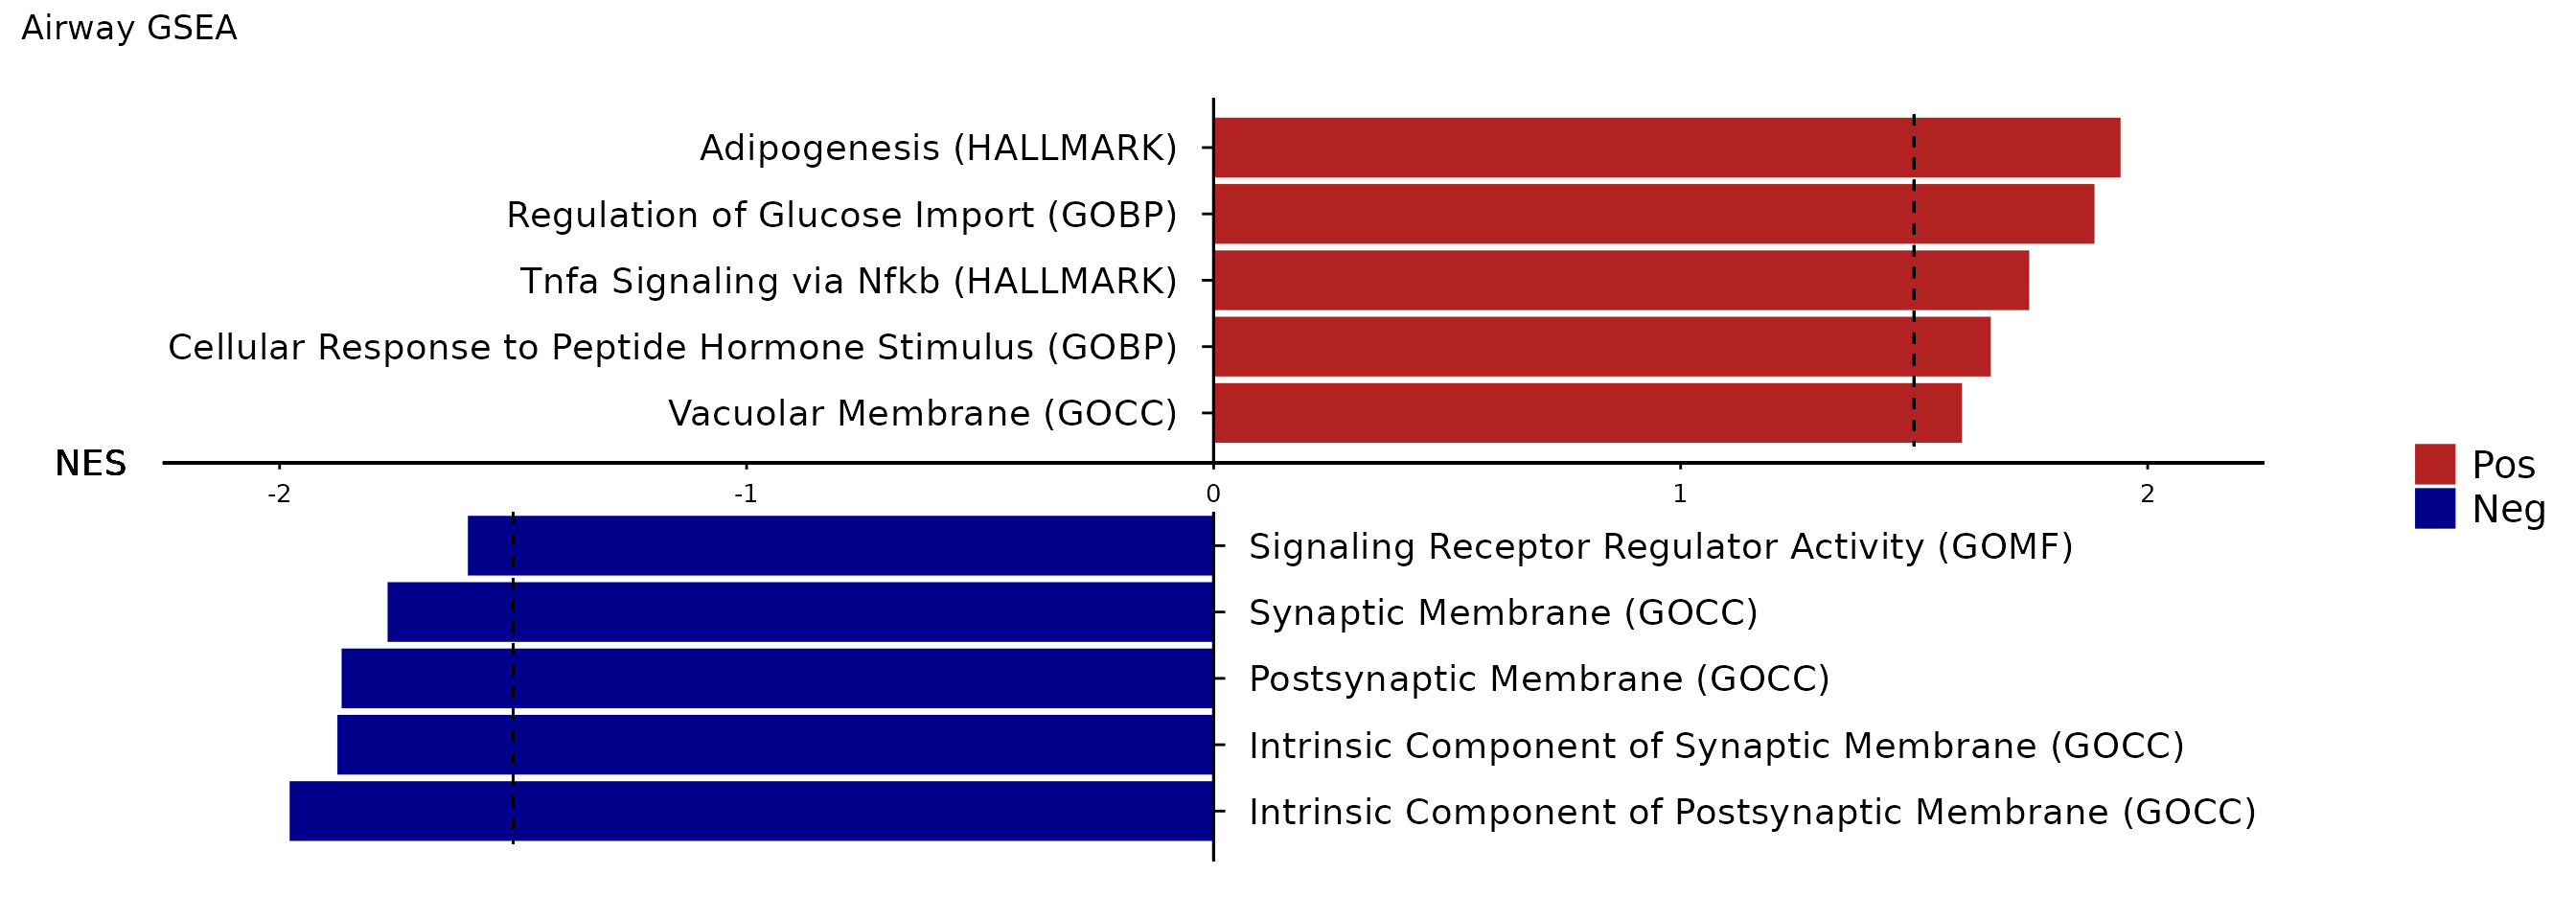
Using Rubrary::plot_GSEA_barplot function - simpler
visualization of GSEA NES values but a bit nicer looking?
Rubrary::plot_GSEA_barplot(
  gsea_res = gsea_results,
  gsea_pws = top_pws,
  NES_cutoff = 1.5,
  sig_cutoff = c("pval", 0.05),
  pw_format = TRUE,
  title = "Airway GSEA"
)
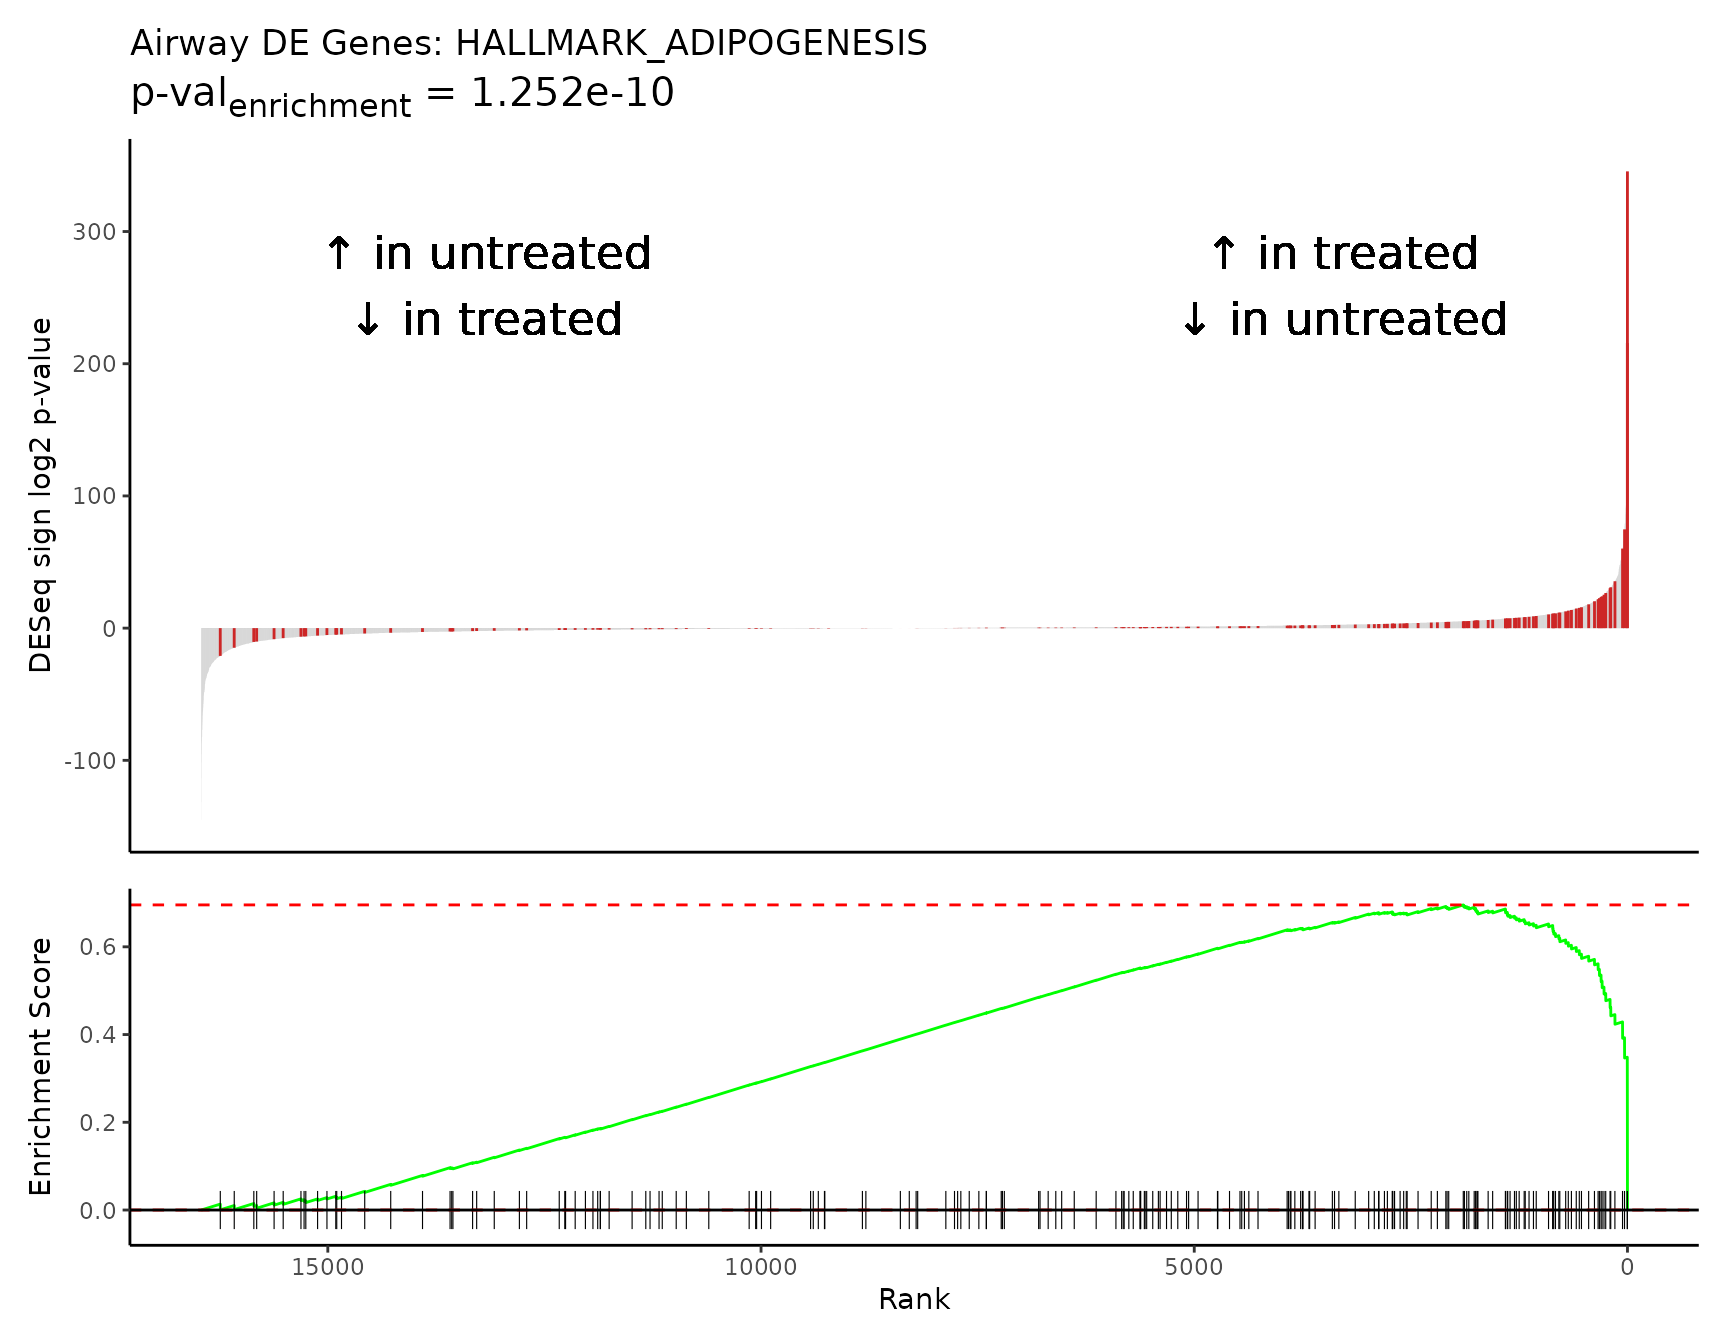
Pathway enrichment plot
Specific pathways of interest can be plotted in GSEA Java app-like enrichment plots that combine a waterfall and mountain plot.
The top enriched pathway from our GSEA results is “HALLMARK_ADIPOGENESIS”, a collection of 196 genes up-regulated during adipocyte (fat cell) differentiation. This is in line with studies reporting the complex effects of glucocorticoids on adipose tissue biology, including differentiation of adipocyte precursors and adipogenesis [6,7].
The maximum absolute value in the Enrichment Score mountain plot
corresponds to the ES value reported in the GSEA
results.
rmarkdown::paged_table(
  gsea_results[gsea_results$pathway == "HALLMARK_ADIPOGENESIS",])
Rubrary::plot_GSEA_pathway(
  sig = airway_deseq_res,
  geneset = pthwys[["HALLMARK_ADIPOGENESIS"]],
  genecol = "hgnc_symbol",
  rankcol = "sign_log_p",
  rankcol_name = "DESeq sign log2 p-value",
  label = FALSE,
  title = "Airway DE Genes: HALLMARK_ADIPOGENESIS",
  lab_high = "\U2191 in treated\n\U2193 in untreated",
  lab_low = "\U2191 in untreated\n\U2193 in treated"
)
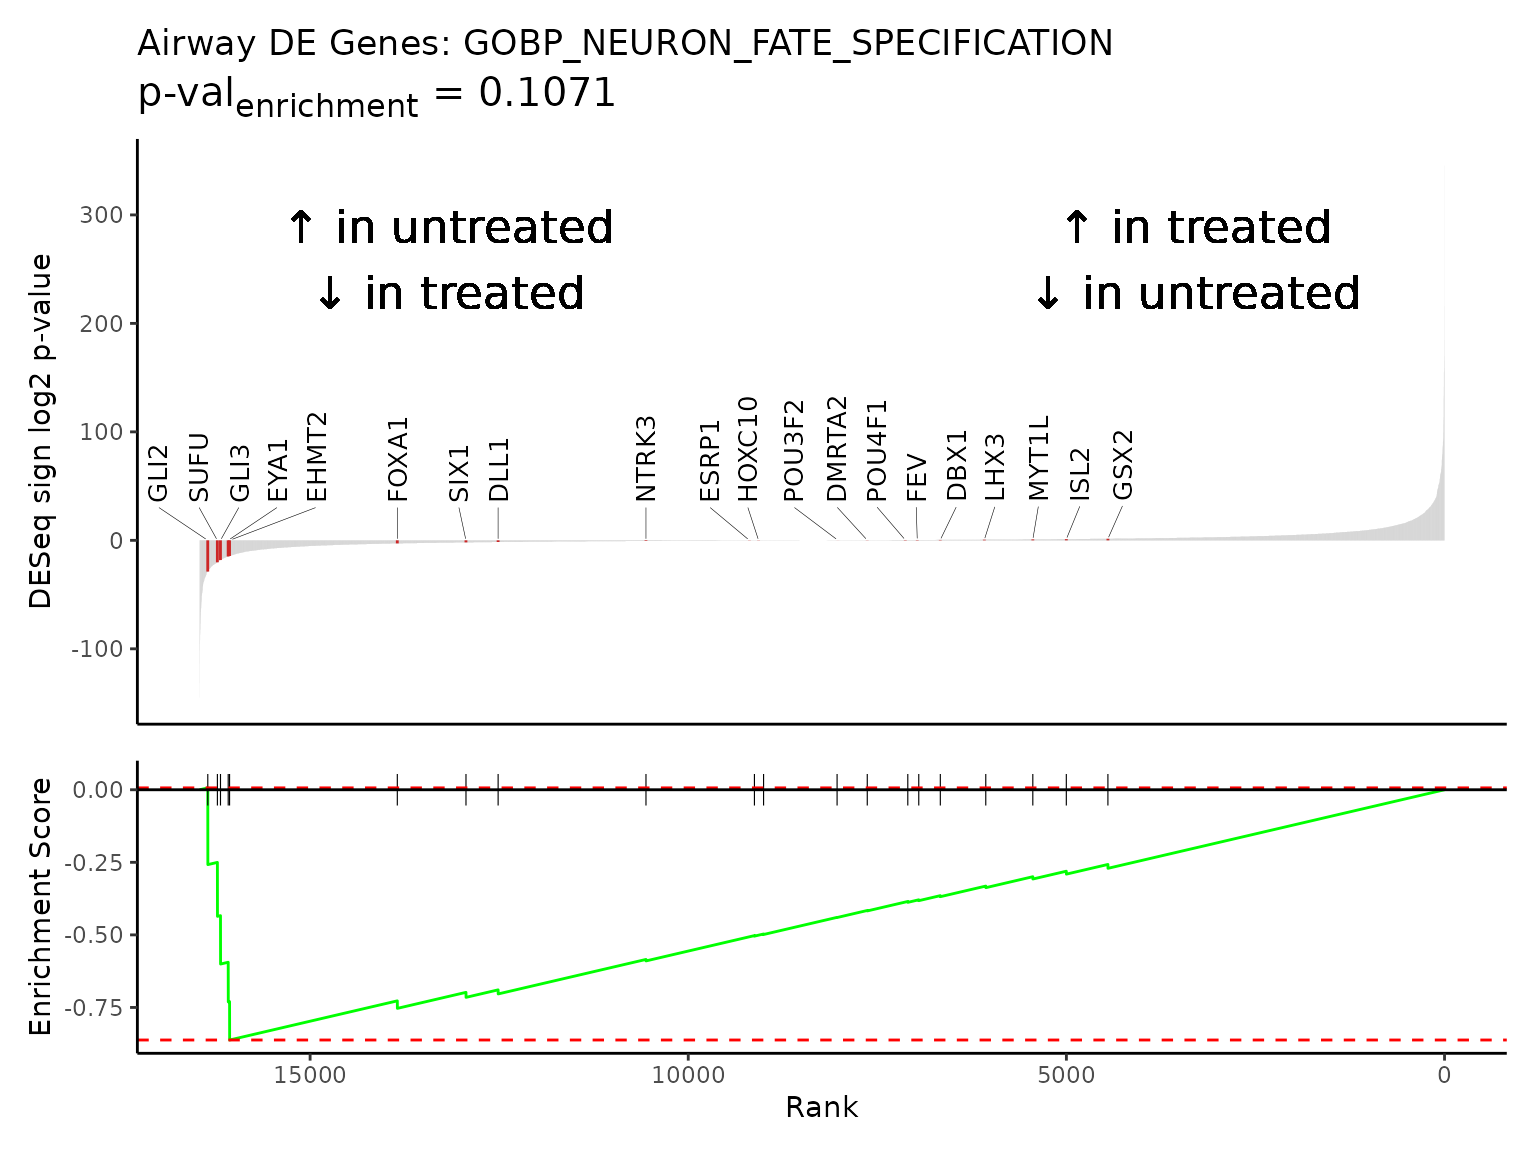
For smaller gene sets, like 20-gene pathway “GOBP_NEURON_FATE_SPECIFICATION”, labeling each gene may be appropriate.
rmarkdown::paged_table(
  gsea_results[gsea_results$pathway == "GOBP_NEURON_FATE_SPECIFICATION",])
Rubrary::plot_GSEA_pathway(
  sig = airway_deseq_res,
  geneset = pthwys[["GOBP_NEURON_FATE_SPECIFICATION"]],
  genecol = "hgnc_symbol",
  rankcol = "sign_log_p",
  rankcol_name = "DESeq sign log2 p-value",
  label = TRUE,
  title = "Airway DE Genes: GOBP_NEURON_FATE_SPECIFICATION",
  lab_high = "\U2191 in treated\n\U2193 in untreated",
  lab_low = "\U2191 in untreated\n\U2193 in treated"
)
Multiple gene set enrichment plots can be created in a batch with
Rubrary::plot_GSEA_batch, a wrapper for
Rubrary::plot_GSEA_pathway that works well with
lapply. We can use the neg_pws list of pathway
names to plot gene enrichment plots for the most significant negatively
enriched pathways.
rmarkdown::paged_table(
  gsea_results[gsea_results$pathway %in% neg_pws[1:3],])
lapply(
  neg_pws[1:3],
  FUN = Rubrary::plot_GSEA_pathway_batch,
  genecol = "hgnc_symbol",
  pthwys = pthwys,
  sig = airway_deseq_res,
  rankcol = "sign_log_p",
  rankcol_name = "DESeq sign log2 p-value",
  hllab = "Pathway genes",
  lab_high = "\U2191 in treated\n\U2193 in untreated",
  lab_low = "\U2191 in untreated\n\U2193 in treated"
)
#> [[1]]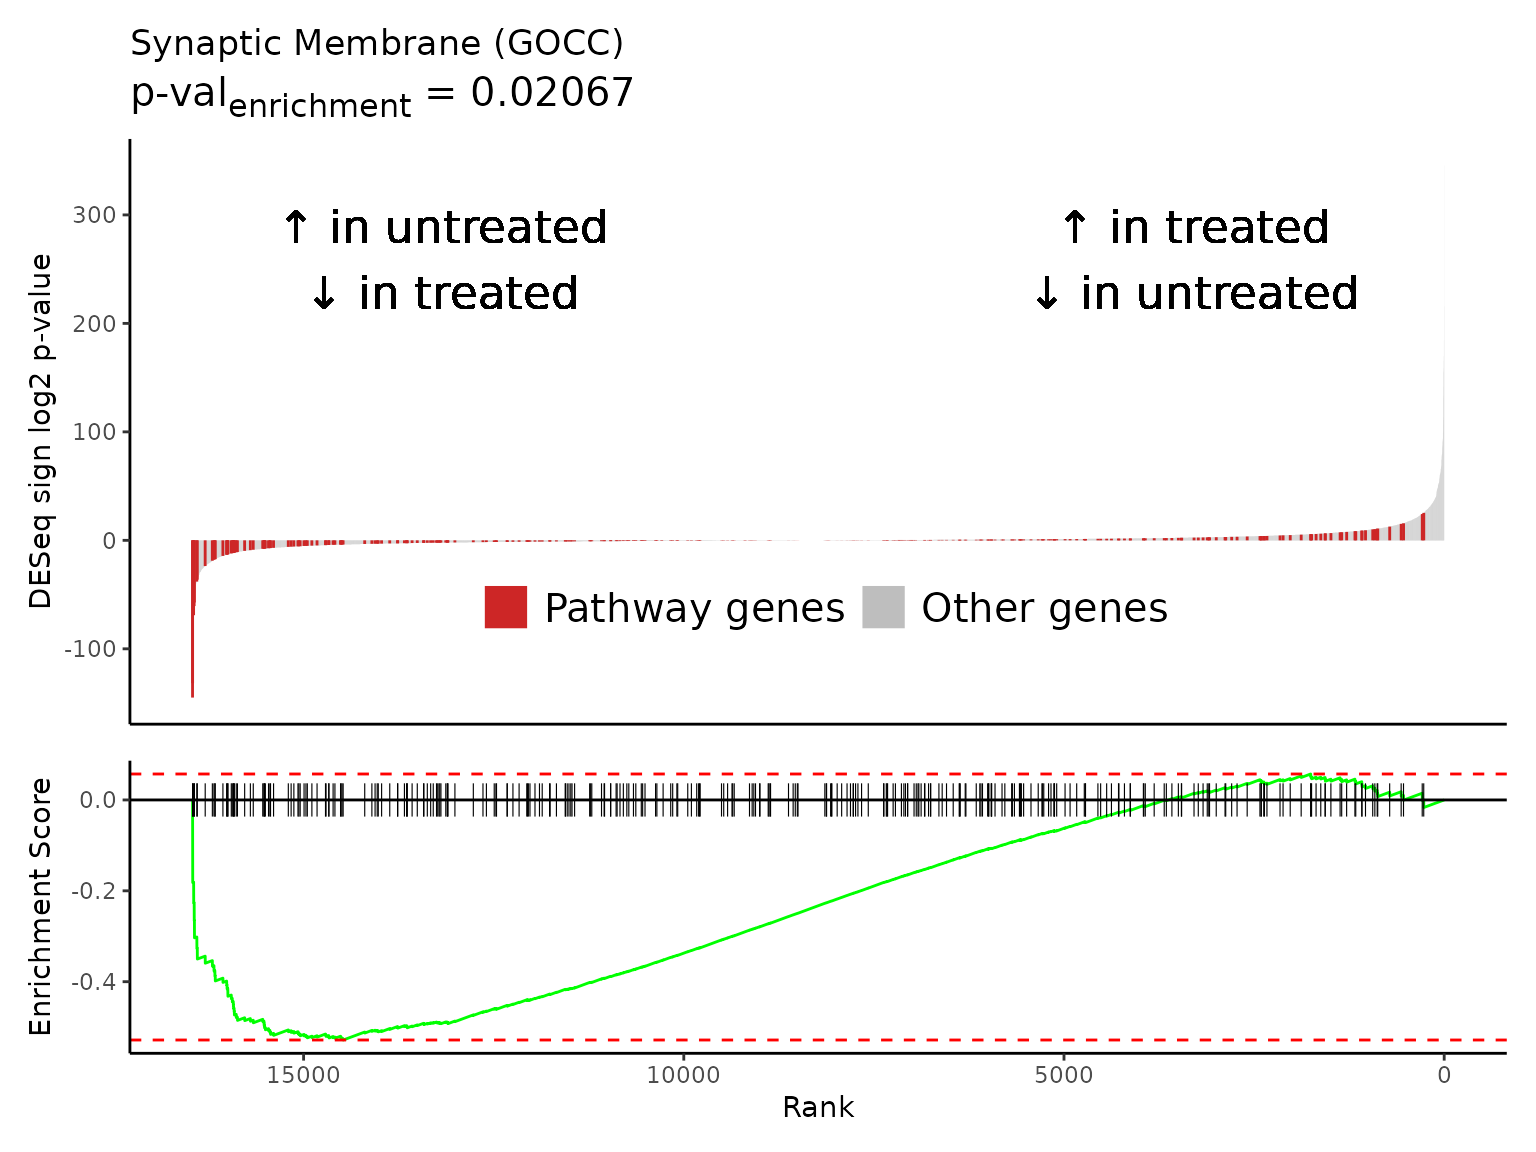
#>
#> [[2]]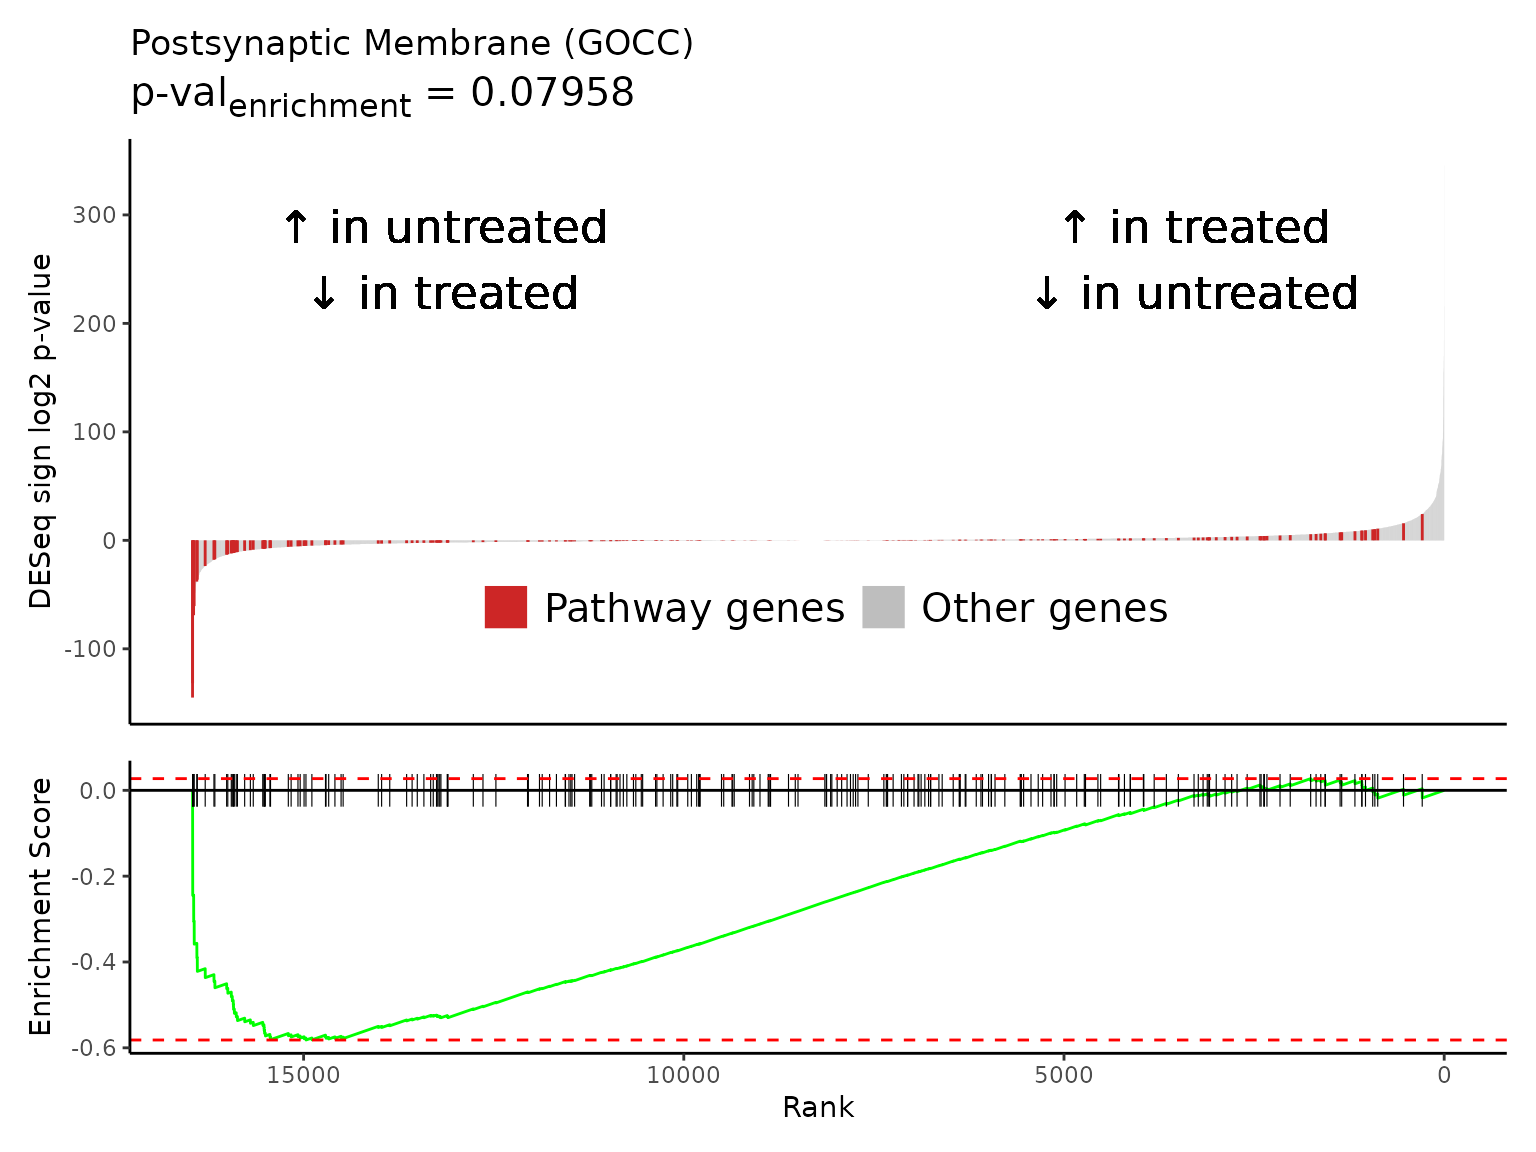
#>
#> [[3]]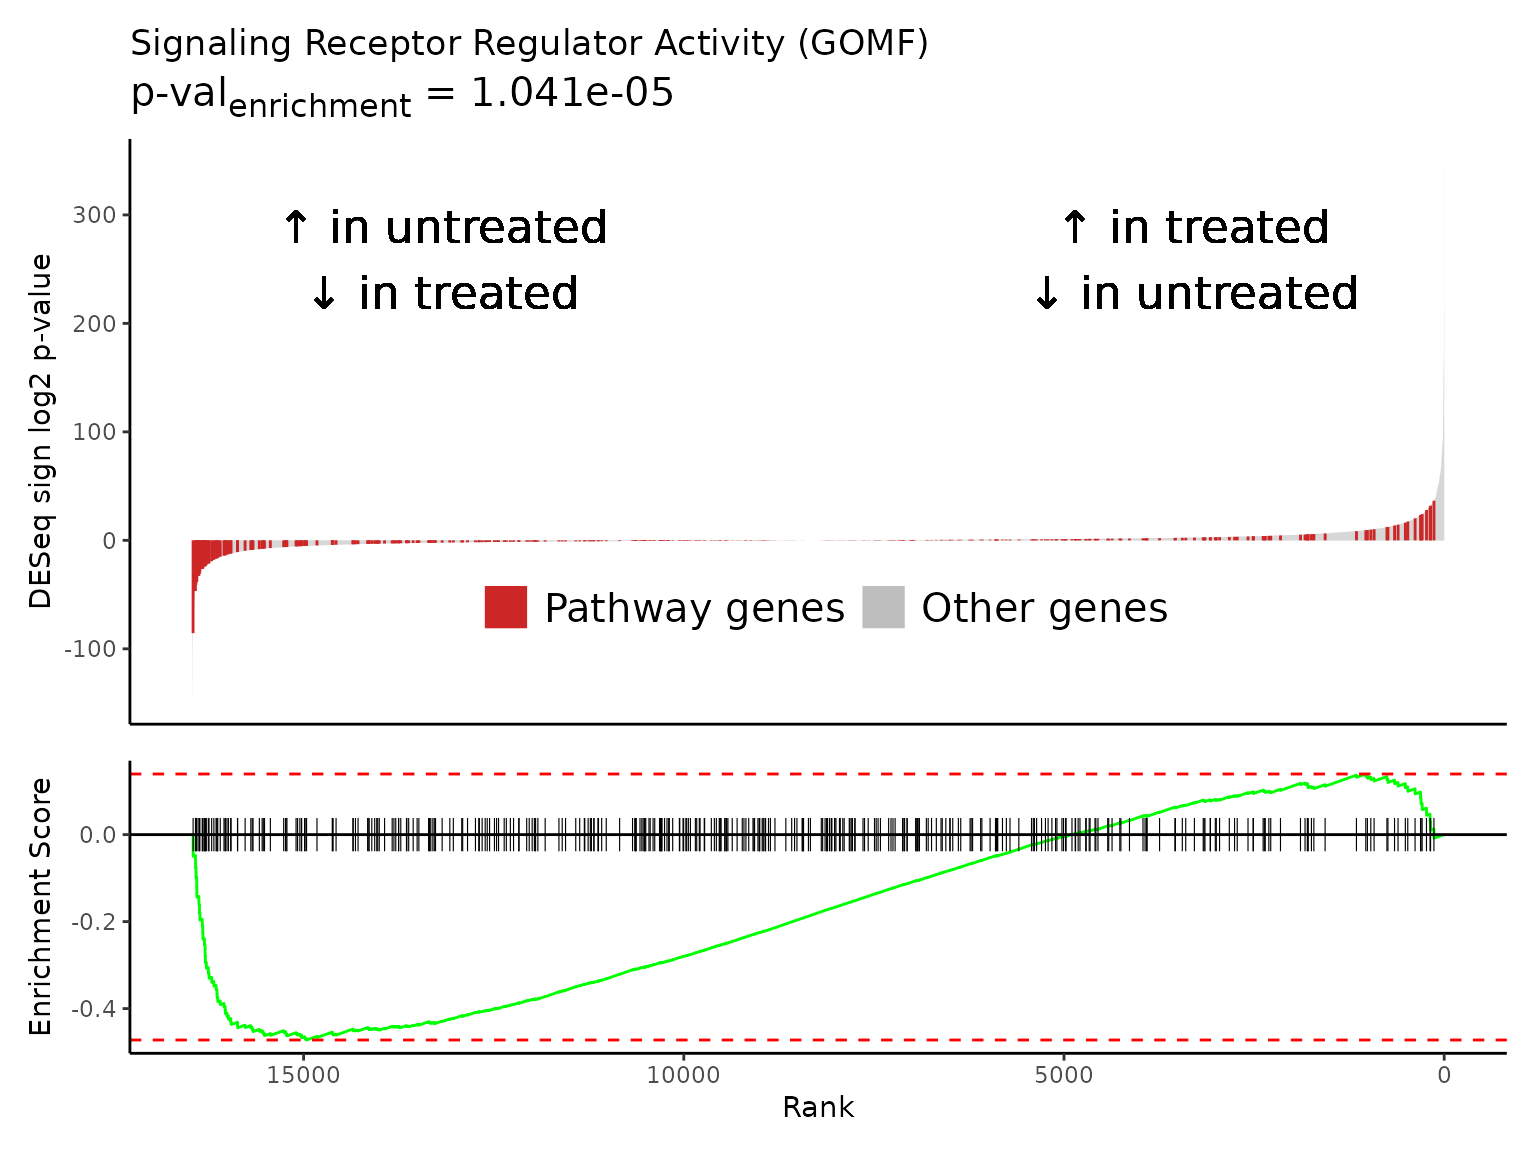
GSEA Squared
GSEAsq_terms <- Rubrary::get_GSEAsq_terms(
  df_GSEA = gsea_results,
  savename = NULL,
  filt_freq = c(5, 500),
  signlogp_base = 10,
  rep0 = .Machine$double.xmin,
  verbose = FALSE,
  plot = TRUE,
  plot_pval = 1e-05,
  seed = 13
)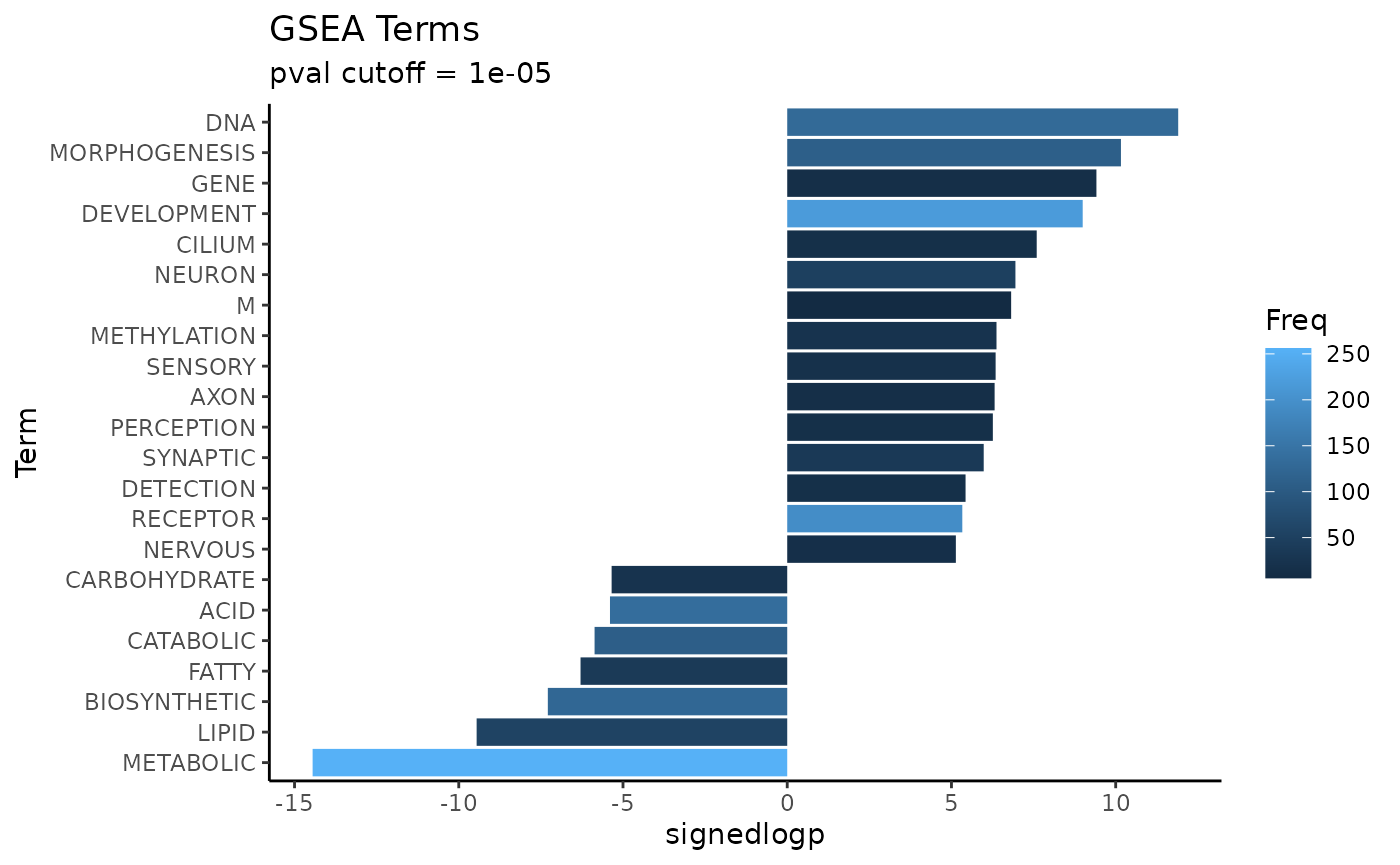
rmarkdown::paged_table(
  head(GSEAsq_terms))
GSEAsq_terms_plt <- head(GSEAsq_terms$Term)
GSEAsq_terms_plt
#> [1] "METABOLIC"     "DNA"           "MORPHOGENESIS" "LIPID"
#> [5] "GENE"          "DEVELOPMENT"
GSEAsq <- Rubrary::run_GSEA_squared(
  df_GSEA = gsea_results,
  get_terms = FALSE, verbose = FALSE,
  categories = GSEAsq_terms_plt,
  cat_terms = GSEAsq_terms_plt,
  plot_pval = TRUE,
  plot_type = "jitter"
)
names(GSEAsq) # Various outputs as list
#> [1] "plot"       "pathways"   "categories"
GSEAsq$plot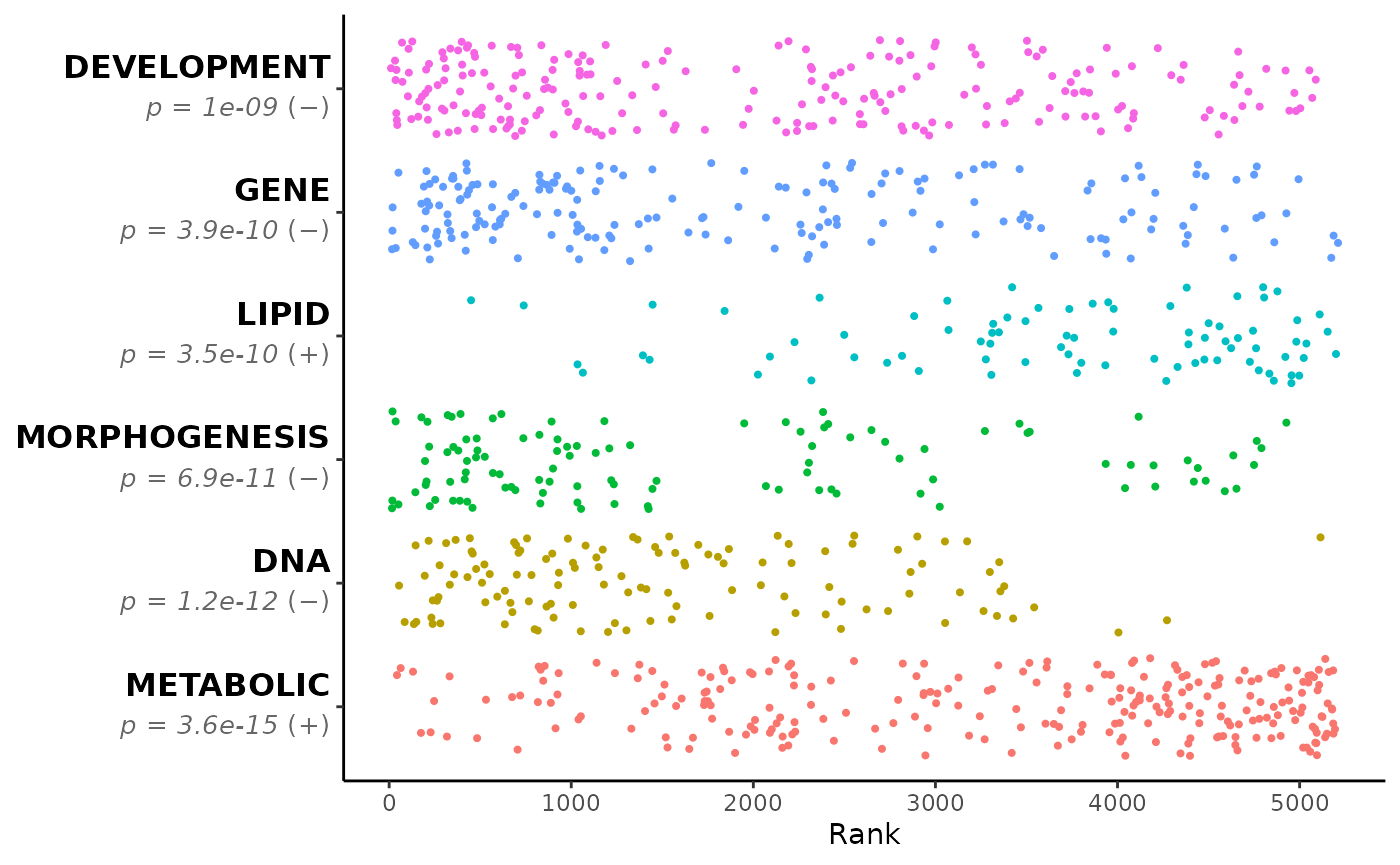
rmarkdown::paged_table(head(GSEAsq$pathways))
rmarkdown::paged_table(GSEAsq$categories)