Setup
library(Rubrary)
library(dplyr)
#>
#> Attaching package: 'dplyr'
#> The following objects are masked from 'package:stats':
#>
#>     filter, lag
#> The following objects are masked from 'package:base':
#>
#>     intersect, setdiff, setequal, union
library(tibble)

# For `airway` install
r = getOption("repos")
r["CRAN"] = "http://cran.us.r-project.org"
options(repos = r)
Introduction
The example dataset for this vignette comes from the paper [1] below:
Himes et al. (2014). “RNA-Seq Transcriptome Profiling Identifies CRISPLD2 as a Glucocorticoid Responsive Gene that Modulates Cytokine Function in Airway Smooth Muscle Cells.” PLoS ONE, 9(6), e99625. https://doi.org/10.1371/journal.pone.0099625.
From the abstract:
Using RNA-Seq, a high-throughput sequencing method, we characterized transcriptomic changes in four primary human ASM cell lines that were treated with dexamethasone—a potent synthetic glucocorticoid (1 µM for 18 hours).
The experiment was performed on human airway smooth muscle (ASM) cells. Glucocorticoids are a commonly used drug to treat asthma for its anti-inflammatory effects in lung tissue. The goal of the experiment was to characterize the mechanism of glucocorticoid inflammation suppression through RNAseq. Himes et al. found a number of glucocorticoid-responsive genes such as DUSP1 and CRISPLD2. They also identified enrichment in functional annotation of terms such as “glycoprotein/extracellular matrix”, “vasculature development”, and “circulatory system process”.
In the original paper, the authors used Cuffdiff 2 to find differential gene expression and used the NIH Database for Annotation, Visualization, and Integrated Discovery (DAVID) for gene set enrichment analysis.
Load data
The package airway contains data from the Himes et
al. paper in the form of a RangedSummarizedExperiment object and is
hosted on Bioconductor.
Get airway data from package
if (!requireNamespace("airway", quietly = TRUE)){
  BiocManager::install("airway")
}

library(airway)
data(airway)
Get counts and sample annotation
The gene expression data is represented in counts. There are 4
samples treated with dexamethasone (anno$dex == "trt") and
4 untreated samples (anno$dex == "untrt").
# Counts
cts <- assay(airway, "counts")
# Annotation
anno <- colData(airway) %>% as.data.frame()
anno$dex <- relevel(anno$dex, "untrt") # Set untreated as first factor

rmarkdown::paged_table(data.frame(cts))
rmarkdown::paged_table(anno)Replace Ensembl ID w/ HGNC symbol
airway gene names are given in Ensembl
ID, but HGNC
gene symbols can be easier to interpret in downstream analysis and
more compatible with gene set enrichment analysis (GSEA) tools.
# Gene format is currently in Ensembl ID format
head(rownames(cts))
#> [1] "ENSG00000000003" "ENSG00000000005" "ENSG00000000419" "ENSG00000000457"
#> [5] "ENSG00000000460" "ENSG00000000938"

library(biomaRt)
# Load Mart object - database of Homo sapiens genes from Ensembl
mart <- biomaRt::useDataset(
  dataset = "hsapiens_gene_ensembl",
  mart = biomaRt::useMart("ENSEMBL_MART_ENSEMBL",
                          host="https://useast.ensembl.org"))

conv <- Rubrary::convert_genes(
    genes = rownames(cts),
    from_to = c("ensembl_gene_id", "hgnc_symbol"),
    mart = mart, table = T) %>%
  filter(hgnc_symbol != "") %>% # Exclude unmatched HGNC symbols
  distinct(hgnc_symbol, .keep_all = T)

cts <- cts %>%
  as.data.frame() %>%
  tibble::rownames_to_column("ensembl_gene_id")

cts_hgnc <- dplyr::left_join( # Join stats with HGNC symbol table
  conv, cts, by = "ensembl_gene_id") %>%
  dplyr::select(!ensembl_gene_id) %>%
  tibble::column_to_rownames("hgnc_symbol")

# Genes now have associated HGNC symbols
rmarkdown::paged_table(head(cts_hgnc))
Visualize samples w/ PCA
Since we already created the Mart object when converting
gene symbols, we can reuse it to avoid querying the BioMart database
again and load protein coding genes efficiently.
# Upper quartile normalize
cts_UQ <- Rubrary::quantile_norm(cts_hgnc, q = 75)
# Log transform
pc_genes <- Rubrary::get_PC_genes(mart)
cts_log2UQ <- Rubrary::get_log_coding_geneexp(cts_UQ, pc_genes = pc_genes)
#> Warning: 400 genes not found in dataframe gene list:
#> MAFIP, PRAMEF27, HNRNPCL3, HNRNPCL2, PRAMEF26, PRAMEF13, PRAMEF18, RPS4Y2, FCGBP, DUX4L8, ...
#> ** Search may take a long time to run!
# Rubrary::run_PCA
airway_PCA <- Rubrary::run_PCA(cts_log2UQ)
#> ** Cumulative var. exp. >= 80% at PC 4 (81.3%)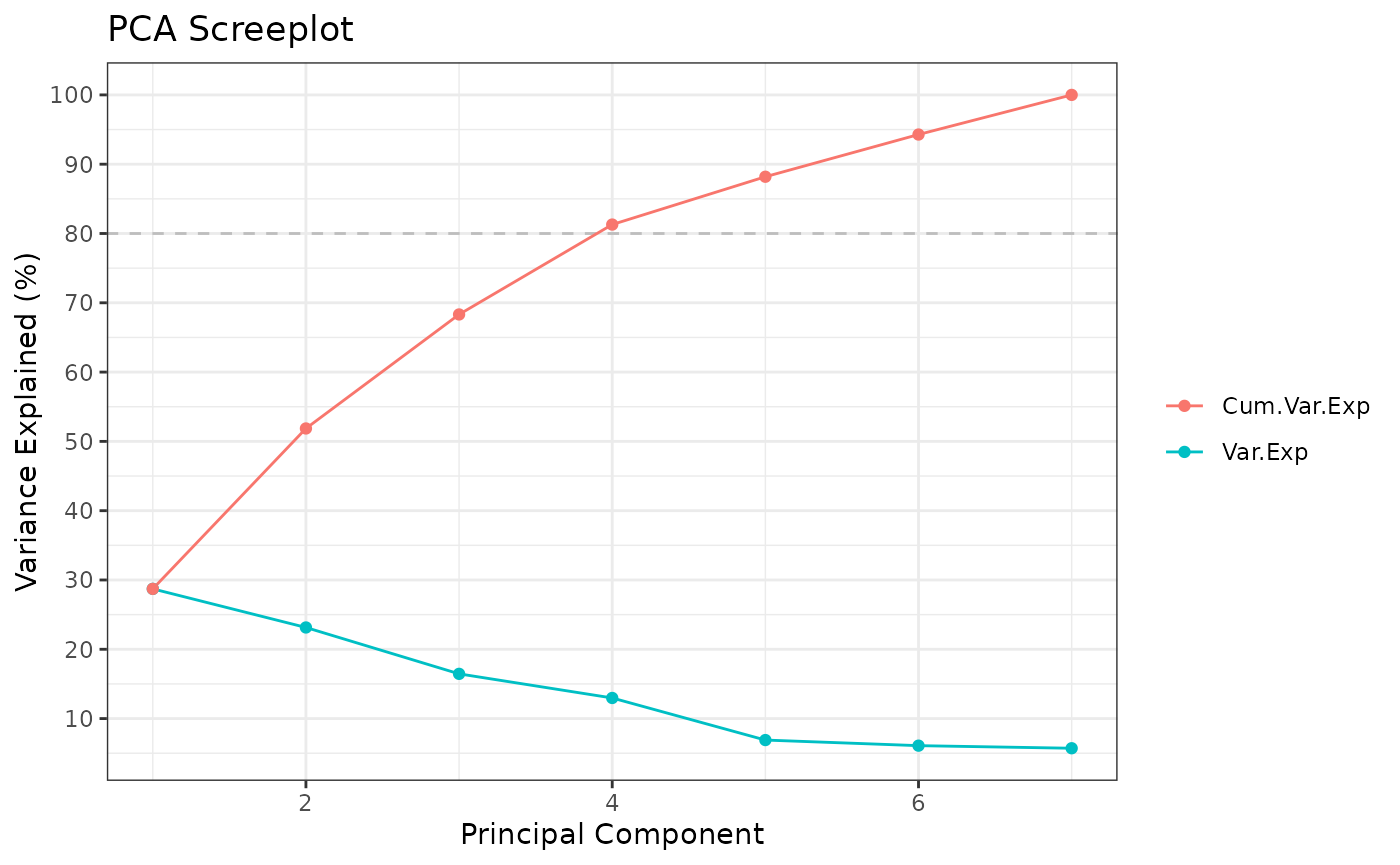
# Rubrary::plot_PCA
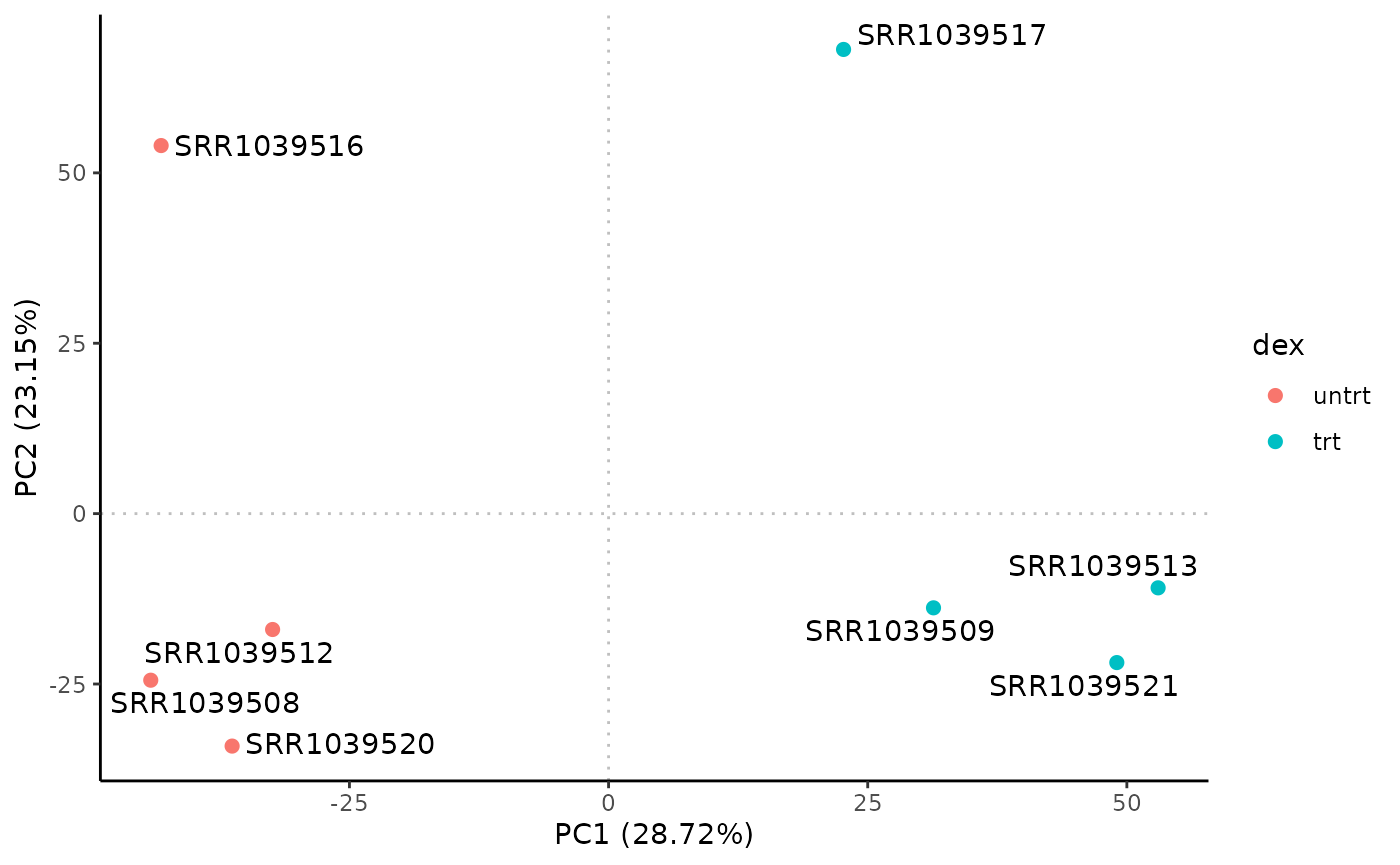
Rubrary::plot_PCA(
df_pca = airway_PCA,
anno = tibble::rownames_to_column(anno, "Sample_ID"),
annoname = "Sample_ID",
annotype = "dex",
label = TRUE
)
# Rubrary::plot_PCA_matrix
Rubrary::plot_PCA_matrix(
  df_pca = airway_PCA,
  anno = tibble::rownames_to_column(anno, "Sample_ID"),
  annoname = "Sample_ID",
  annotype = "cell"
)
#> Registered S3 method overwritten by 'GGally':
#>   method from
#>   +.gg   ggplot2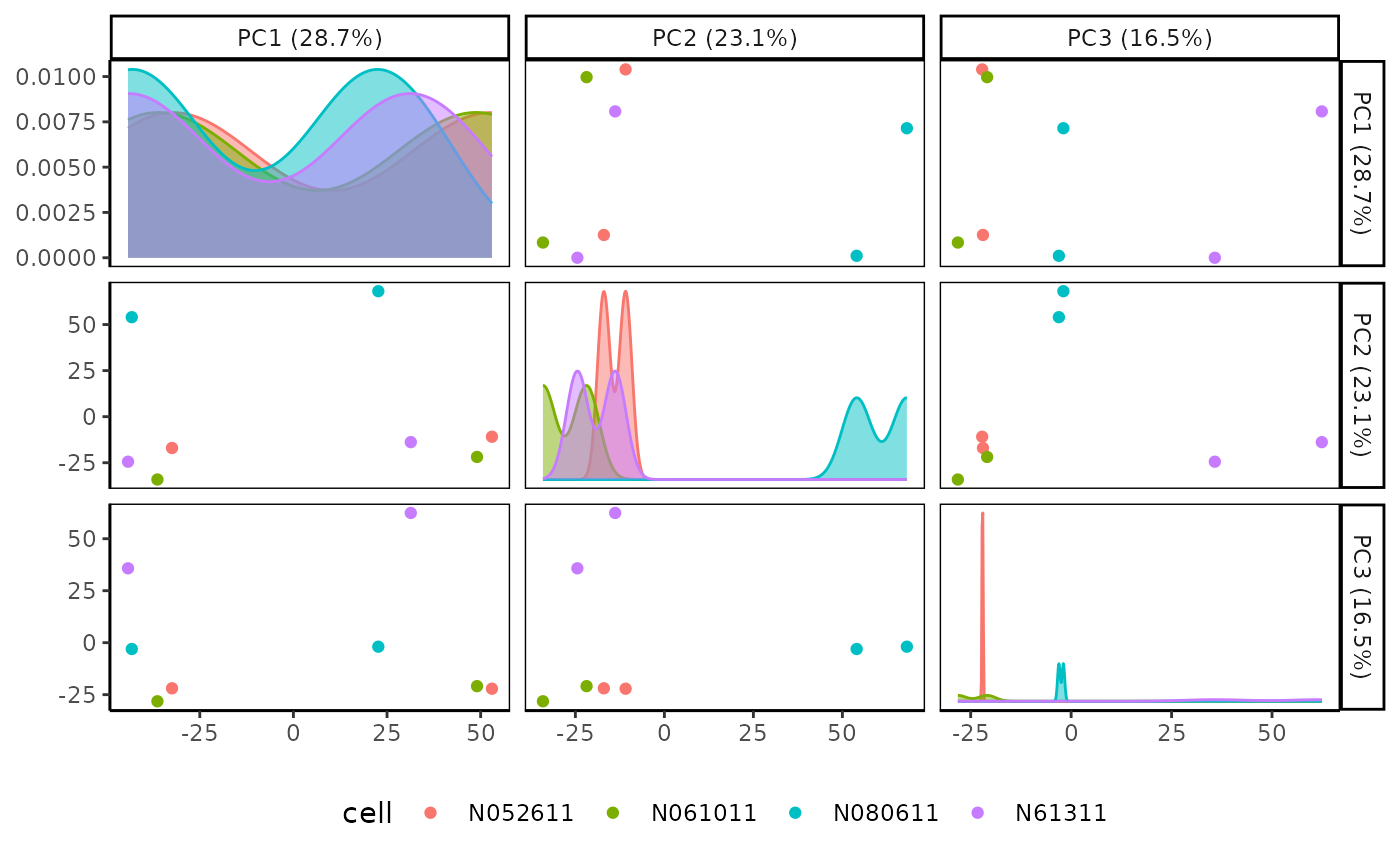
DESeq2 differentially expressed genes
DESeq2 [2] performs
differential gene expression analysis my modeling counts as a negative
binomial distribution.
Create DESeqDataSet object and run DESeq
From DESeq2::results documentation, the
contrast argument can be formatted as:
a character vector with exactly three elements: the name of a factor in the design formula, the name of the numerator level for the fold change, and the name of the denominator level for the fold change (simplest case)
Thus, the fold change per gene in the results represents the change
in the dex condition, \(FC =
\frac{\text{trt}}{\text{untrt}}\). \(FC
> 1\) results in \(\log(FC) >
0\), an increase in gene expression in treated samples relative
to untreated samples.
Rubrary::output_DESeq takes the DESeqResults object,
transforms it to a dataframe, and adds a sign log2 p-value column.
library(DESeq2)

dds <- DESeqDataSetFromMatrix(
  countData = cts_hgnc[,rownames(anno)],
  colData = anno,
  design = ~ dex)

dds <- DESeq(dds)
#> estimating size factors
#> estimating dispersions
#> gene-wise dispersion estimates
#> mean-dispersion relationship
#> final dispersion estimates
#> fitting model and testing
res <- results(dds, contrast = c("dex", "trt", "untrt"))
deseq_res_df <- Rubrary::output_DESeq(res)
Filter to protein coding genes
For ease of interpretation, the DE genes results can also be filtered
to protein coding genes only. Rubrary::filter_genes() can
filter with the list of protein coding genes retrieved with
Rubrary::get_PC_genes().
deseq_res_df_PC <- Rubrary::filter_genes(
df = deseq_res_df,
gene_col = "gene",
genes_filt = pc_genes
) %>%
`rownames<-`(NULL) %>%
as.data.frame() %>%
tibble::column_to_rownames("gene")
#> Warning: 3021 genes not found in dataframe gene list:
#> MAFIP, PRAMEF11, PRAMEF4, PRAMEF10, PRAMEF27, HNRNPCL3, HNRNPCL2, PRAMEF26, PRAMEF13, PRAMEF18, ...
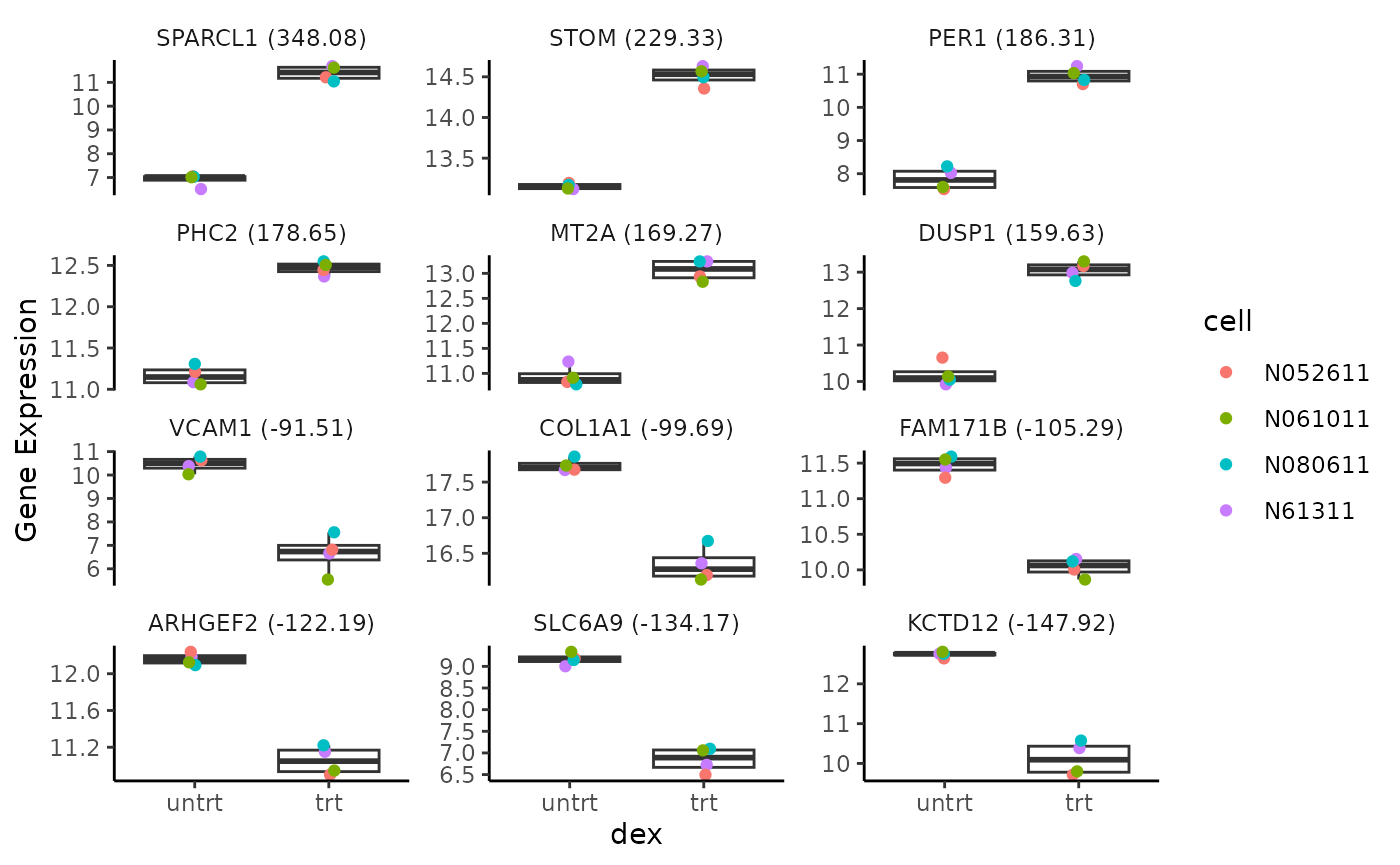
#> ** Search may take a long time to run!Gene expression boxplot
Rubrary::plot_DEgene_boxplot(
  data = cts_log2UQ,
  anno = anno,
  anno_sig = "dex",
  anno_type = "cell",
  sig_DE = deseq_res_df_PC
)
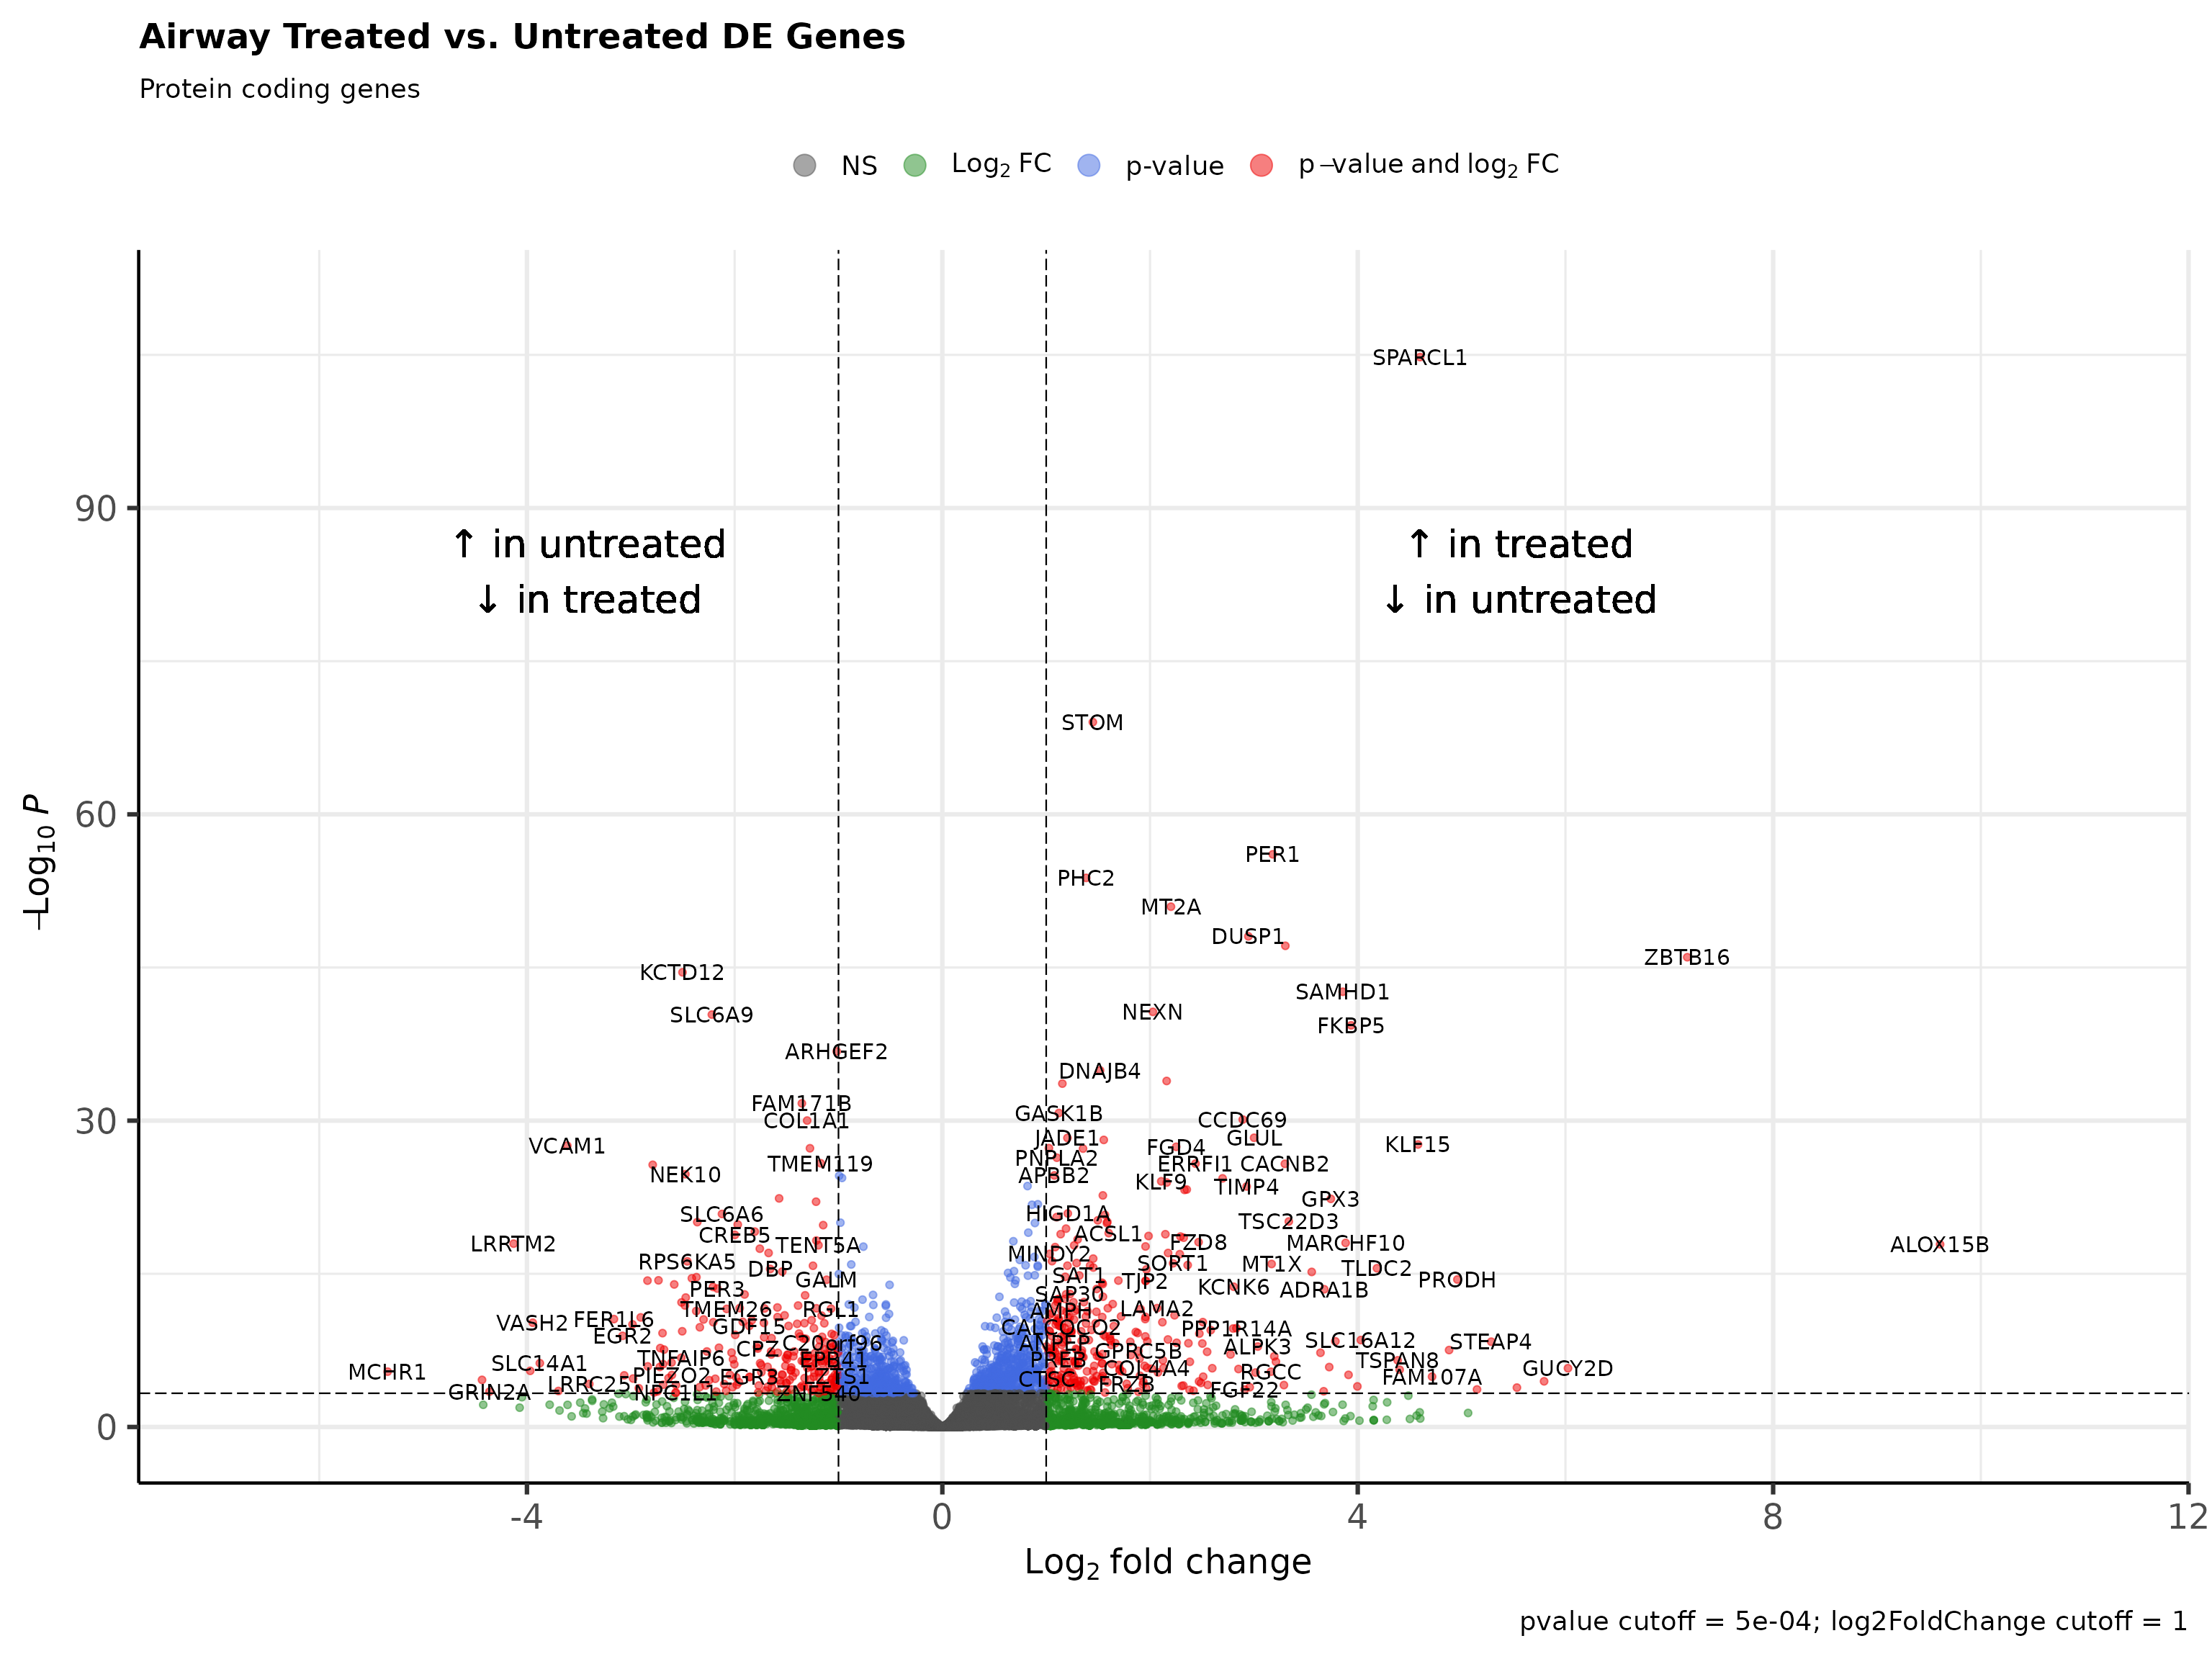
Volcano plot
DESeq results can be visualized through volcano plots. Volcano plots show that top and bottom differentially expressed genes when sorted by decreasing signed log p value present as outliers on the top right and top left.
rmarkdown::paged_table(
  head(deseq_res_df_PC[order(deseq_res_df_PC$sign_log_p, decreasing = T),]))
rmarkdown::paged_table(
  tail(deseq_res_df_PC[order(deseq_res_df_PC$sign_log_p, decreasing = T),]))
Rubrary::plot_volcano(
  df = tibble::rownames_to_column(deseq_res_df_PC, "gene"),
  names = "gene",
  x = "log2FoldChange", y = "pvalue",
  FCcutoff = 1, pCutoff = 5e-04,
  title = "Airway Treated vs. Untreated DE Genes",
  xlab_high = "\U2191 in treated\n\U2193 in untreated",
  xlab_low = "\U2191 in untreated\n\U2193 in treated",
  subtitle = "Protein coding genes"
)