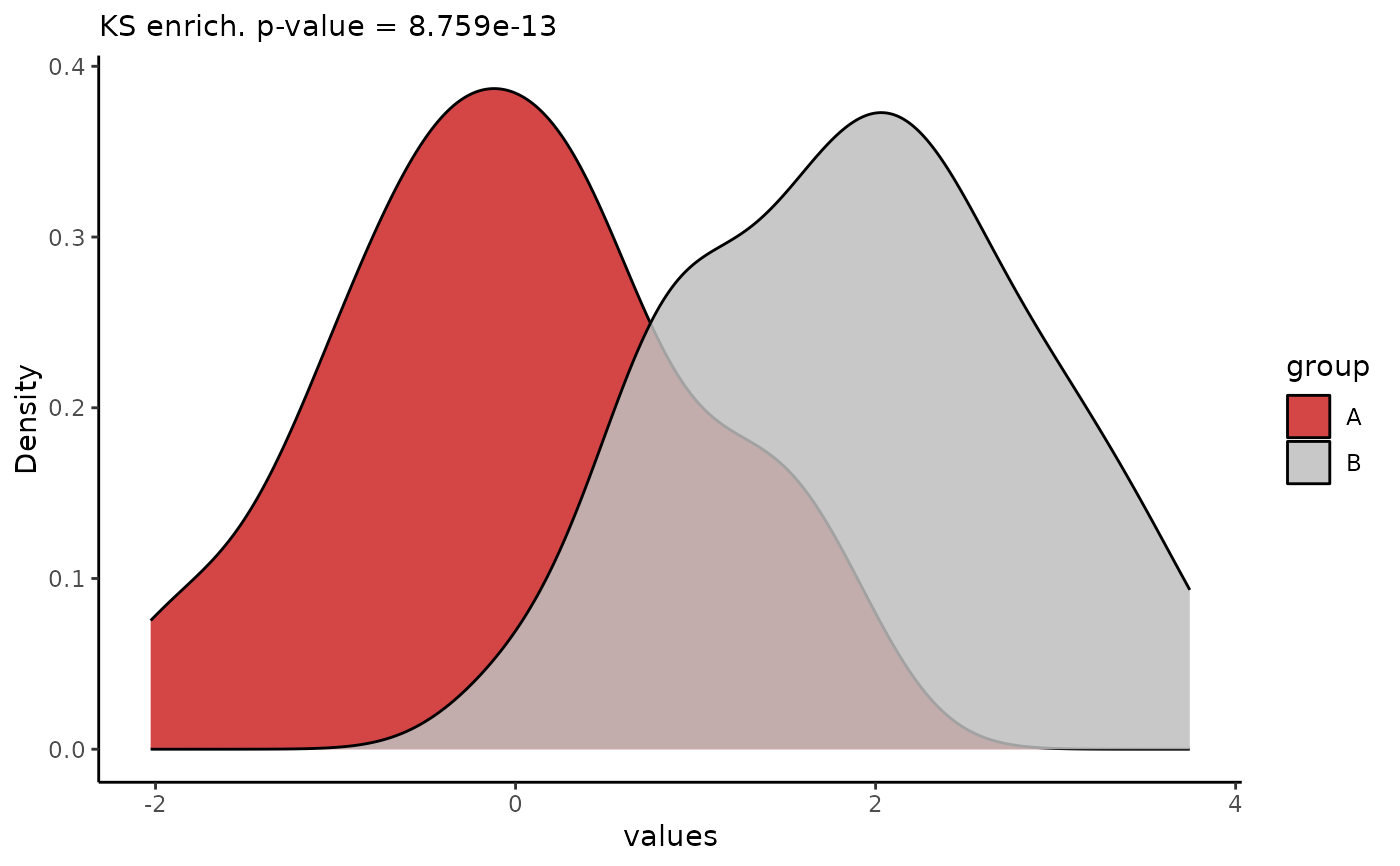
Density plot by group
Usage
plot_density(
  df,
  value,
  group,
  group2 = NA,
  title = NA,
  pval = T,
  xlab = value,
  colors = c("firebrick3", "gray"),
  rug = F,
  rug_label = F,
  rug_lab_nudge = 1e-05,
  savename = NA,
  width = 6,
  height = 4
)
Arguments
- df
dataframe
- value
string; colname of values
- group
string; colname of group info
- group2
string; group of interest
- title
string; plot title
- pval
logical; get KSpval first group vs others
- xlab
string; x-axis label
- colors
vector; # of colors = to # of groups
- rug
logical; put rug plot on x axis
- rug_label
logical; label rug ticks with first df column
- rug_lab_nudge
numeric; fine-tune distance of label from x-axis
- savename
string; filepath to save PNG under
- width
numeric; ggsave width of plot
- height
numeric; ggsave height of plot