Ignores NA values for mean & median calculation.
Usage
plot_distribution(
  values,
  check_normal = FALSE,
  hist = FALSE,
  title = "Distribution",
  xlab = "Value",
  savename = NULL,
  height = 5,
  width = 7
)
Arguments
- values
numeric vector; values to check distribution for
- check_normal
logical; perform SW test for normality?
- hist
logical; include histogram?
- title
string; plot title
- xlab
string; x-axis label
- savename
string; filepath to save figure under
- height
numeric; plot height
- width
numeric; plot width
Examples
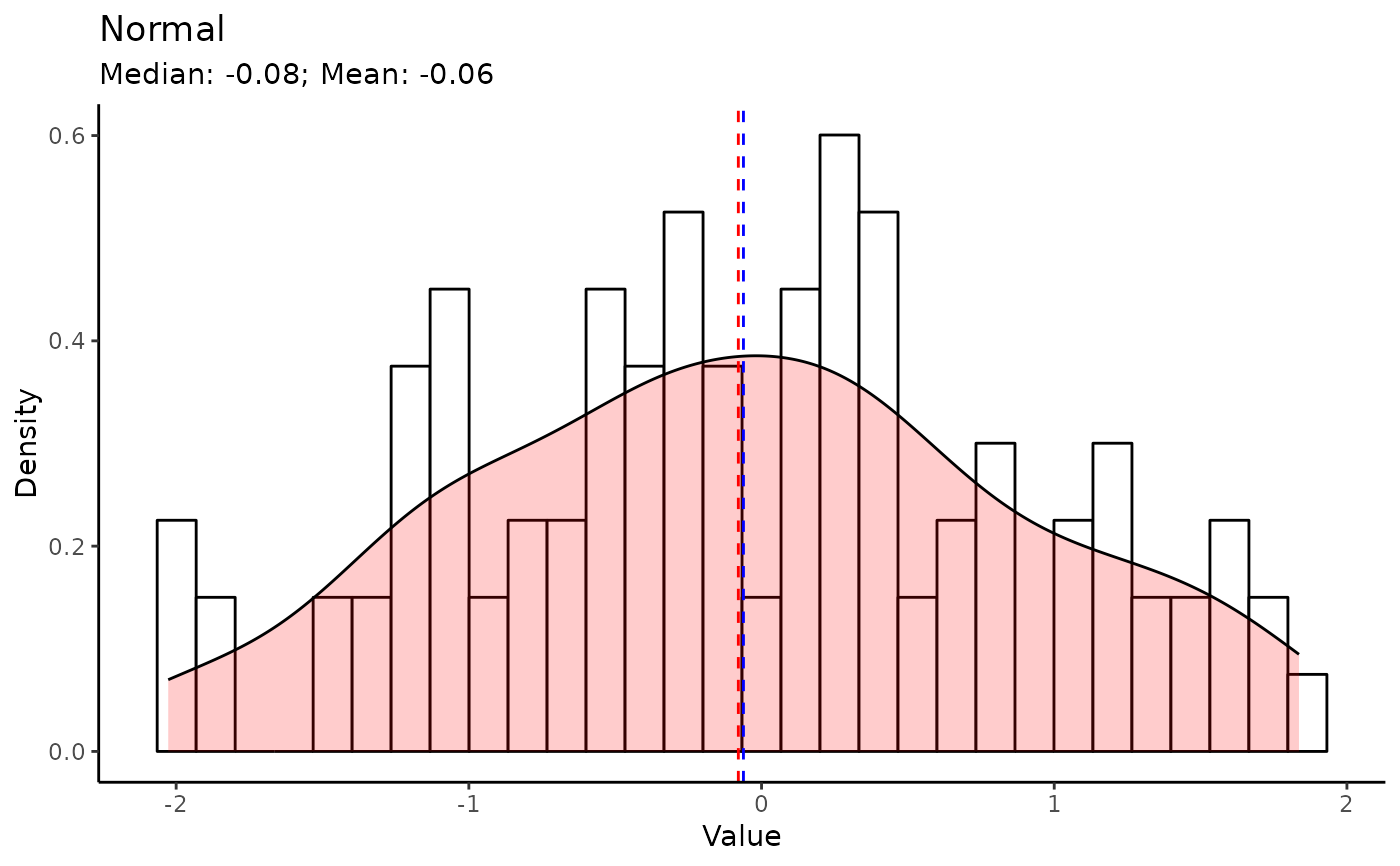
set.seed(13)
vals_normal <- rnorm(100)
plot_distribution(values = vals_normal, title = "Normal", hist = TRUE, check_normal = TRUE)
#> Shapiro-Wilk normality test: p-value = 0.273
#> ** p = 0.273 > 0.05; normal
#> `stat_bin()` using `bins = 30`. Pick better value with `binwidth`.
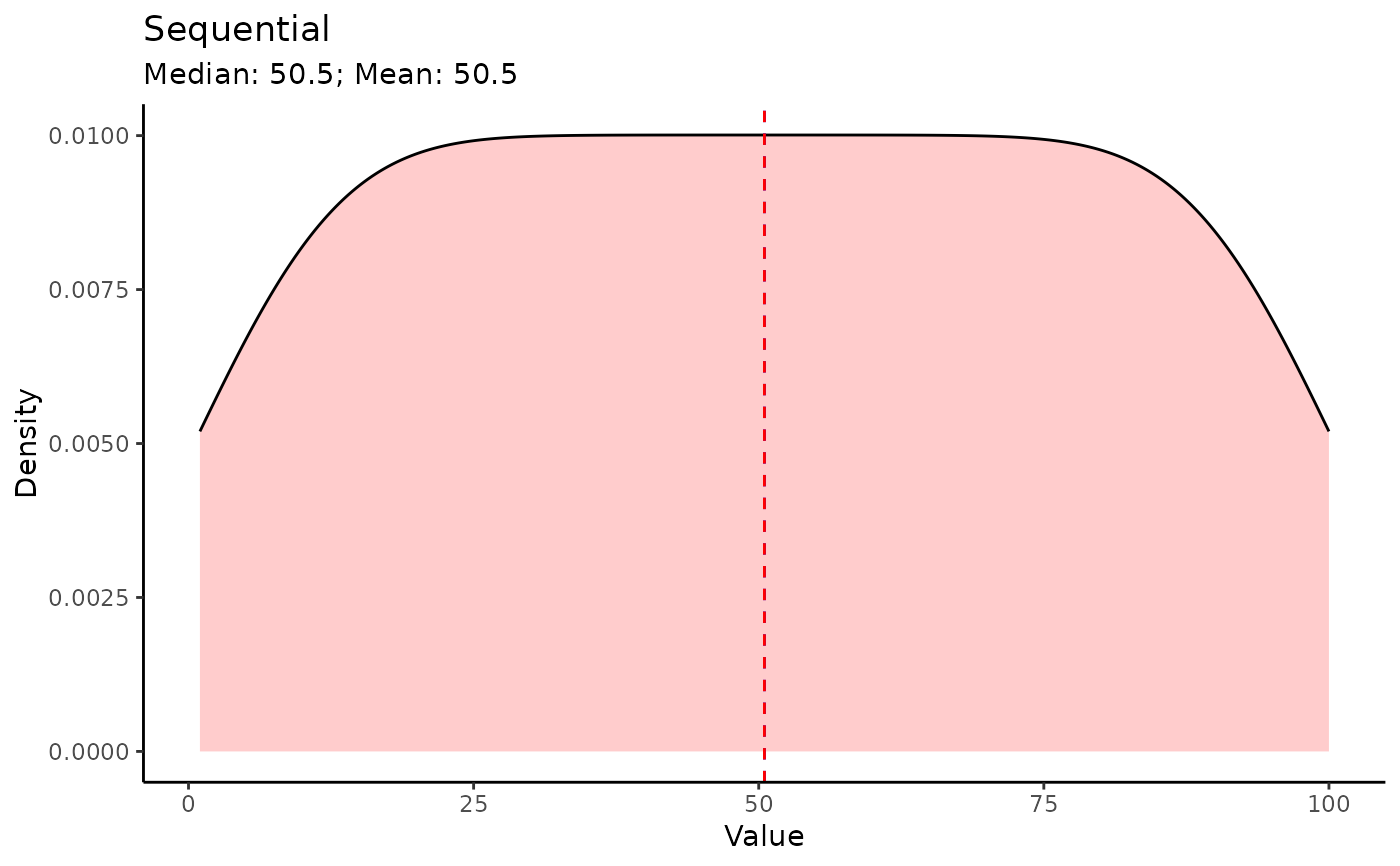
 vals_sequential <- c(1:100)
plot_distribution(values = vals_sequential, title = "Sequential", check_normal = TRUE)
#> Shapiro-Wilk normality test: p-value = 0.00172
#> ** p = 0.00172 <= 0.05; non-normal
vals_sequential <- c(1:100)
plot_distribution(values = vals_sequential, title = "Sequential", check_normal = TRUE)
#> Shapiro-Wilk normality test: p-value = 0.00172
#> ** p = 0.00172 <= 0.05; non-normal