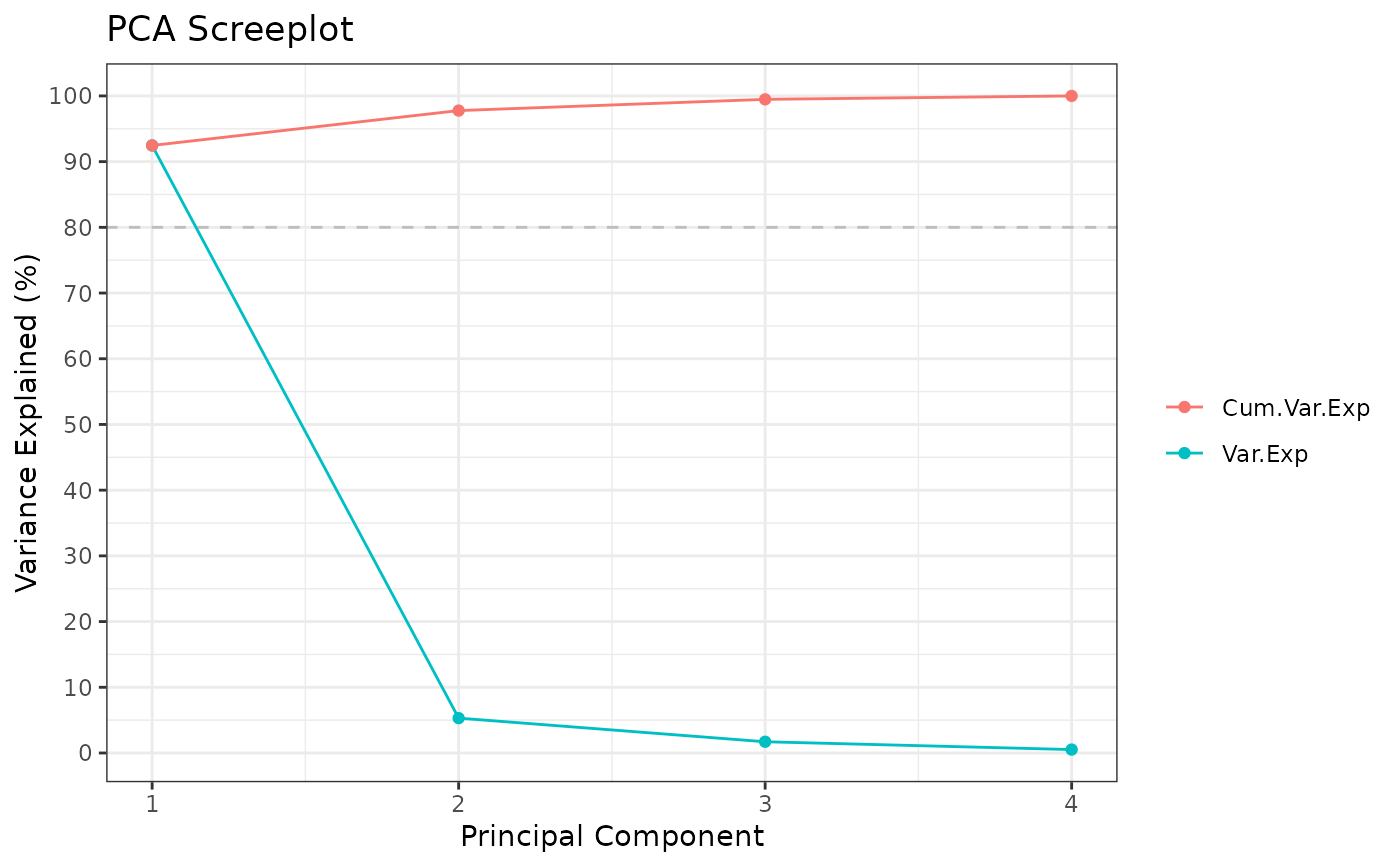
Plot screeplot from prcomp
Usage
plot_screeplot(
  obj_prcomp,
  npcs = ncol(obj_prcomp$x),
  label = FALSE,
  cum_var_exp = 80,
  savename = NULL
)
Arguments
- obj_prcomp
prcomp function output object
- npcs
integer; # of PCs to include in plot
- label
logical; T for % values at points
- cum_var_exp
integer; c(1:100), cumulative variance explained threshold
- savename
string; filepath to save PNG under
Value
Screeplot as ggplot object
Examples
data(iris)
PCA_iris <- Rubrary::run_PCA(t(iris[,c(1:4)]), screeplot = FALSE)
Rubrary::plot_screeplot(PCA_iris)
#> ** Cumulative var. exp. >= 80% at PC 1 (92.5%)