Run GSEA Squared on GSEA results
Usage
run_GSEA_squared(
  df_GSEA,
  categories,
  cat_terms,
  rep0 = 2.2e-16,
  signlogp_base = 10,
  get_terms = FALSE,
  terms_filt_freq = c(5, 500),
  plot_type = c("jitter", "density"),
  plot_pval = TRUE,
  title = NULL,
  cat_colors = NULL,
  savename = NULL,
  plot_fmt = "png",
  height = 8,
  width = 8,
  seed = 13,
  verbose = TRUE
)
Arguments
- df_GSEA
df/string; (path to) GSEA results with
pathwayandNEScolumns- categories
char vector; list of category names
- cat_terms
char vector; list of category terms with each element being keywords separated by "
|", ex. "CELL_CYCLE|MITOTIC|DNA_REPLICATION"- rep0
numeric; value to replace
pval == 0results with, userep0 = 2.2e-16(rounded.Machine$double.eps) to be same as original function- signlogp_base
integer; log base when calculating signed log_base p metric
- get_terms
logical;
TRUEto runRubrary::get_GSEAsq_termsto output filtered table of terms and associated statistics- terms_filt_freq
num vector length 2;
get_GSEAsq_termsarg,filt_freq[1]is minimum frequency,filt_freq[2]is maximum frequency- plot_type
c("jitter", "density"); GSEA squared output plot type- plot_pval
logical;
TRUEto append p-value to category name. Ifggtextpackage is installed, can do fancy markdown formatting- title
string; plot title
- cat_colors
char vector; list of colors corresponding to category
- savename
string; path to save outputs under (no extension)
- plot_fmt
string; file extension to save plot as
- height
numeric; output plot height
- width
numeric; output plot width
- seed
integer; randomization seed
- verbose
logical;
TRUEto output intermediate messages
Value
GSEAsq object with ggplot object plot, df of original GSEA input with categories pathways, df of categories KS statistics categories, and df of terms KS statistics terms if applicable
Examples
library(dplyr)
# Load data
airway_deseq_res <- Rubrary::airway_deseq_res
deseq_stats <- setNames(
airway_deseq_res[,"sign_log_p"],
airway_deseq_res[,"hgnc_symbol"]
)
pthwys <- Rubrary::GSEA_pathways
# Run (f)GSEA
gsea_results <- fgsea::fgsea(
pathways = pthwys,
stats = deseq_stats,
eps = 0.0,
minSize = 15,
maxSize = 500) %>%
arrange(NES)
#> Warning: There are ties in the preranked stats (6.92% of the list).
#> The order of those tied genes will be arbitrary, which may produce unexpected results.
# Run GSEA Squared
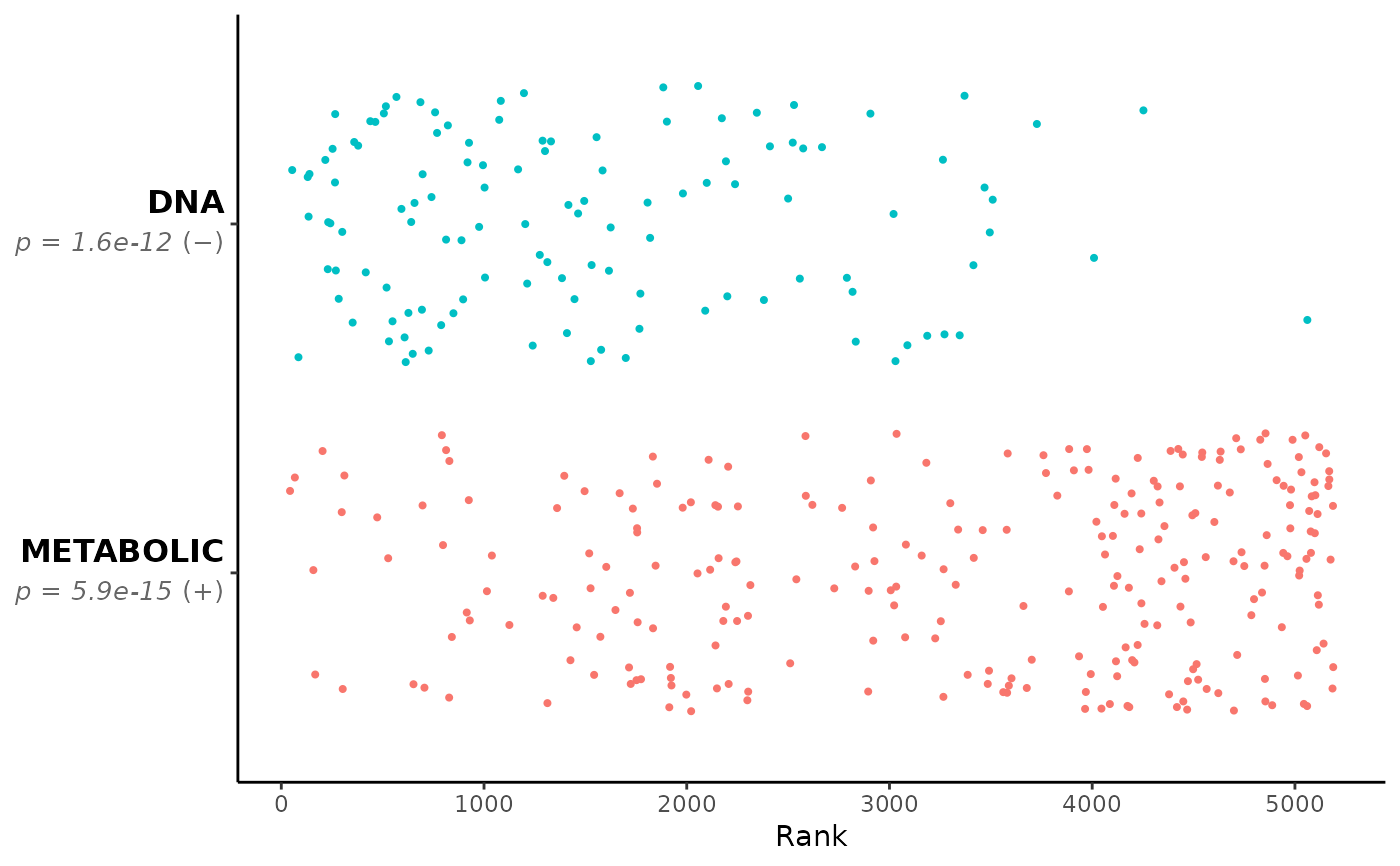
GSEAsq_terms <- c("METABOLIC","DNA")
# Run GSEA squared
GSEAsq <- Rubrary::run_GSEA_squared(
df_GSEA = gsea_results,
get_terms = FALSE, verbose = FALSE,
categories = GSEAsq_terms,
cat_terms = GSEAsq_terms,
plot_pval = TRUE,
plot_type = "jitter"
)
names(GSEAsq) # Various outputs as list
#> [1] "plot" "pathways" "categories"
GSEAsq$plot